IMAGE

FIGURE 4

ID
ZDB-IMAGE-230110-136
Source
Figures for Scott et al., 2022
Image
Figure Caption

FIGURE 4

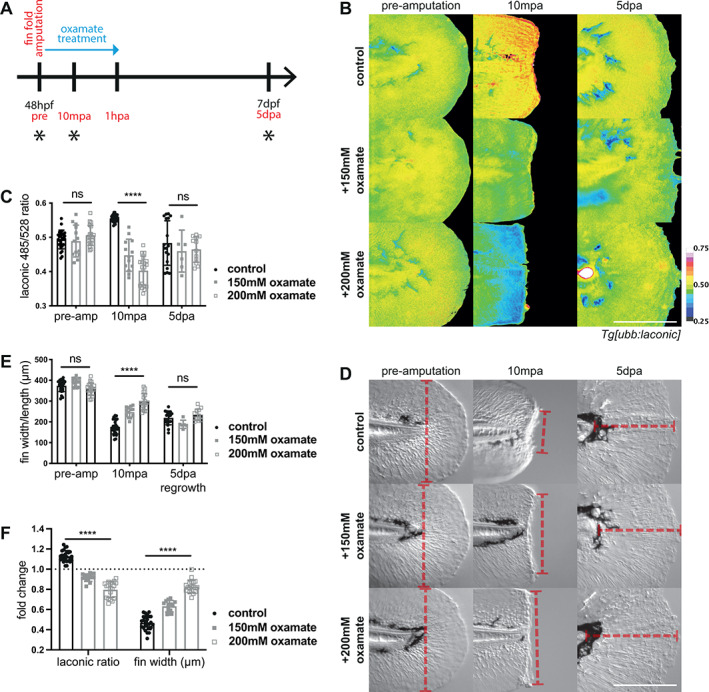
Lactate dehydrogenase inhibition in wound healing. (A) Schematic of the experimental design. Embryos were amputated in the treatment solution and incubated for one hour before washing out the drug, and maintained until regeneration was complete at 120 hpa. Blue arrow indicates period of oxamate treatment and black asterisks indicate time points for imaging. (B) Micrographs of representative Tg[ubb:laconic]lkc1 embryos tails at 48 hpf imaged pre‐amputation, 10 min post amputation with treatment with oxamate or water control, and five‐days post amputation, pseudocoloured to show Laconic ratio. (C) Graph showing quantification of raw Laconic ratios pre‐, 10 min post‐, and five‐days post‐amputation. Two‐way ANOVA to calculate significance, n = 25 (control), n = 13 (150 mM oxamate), n = 19 (200 mM oxamate). (D) DIC micrographs of representative transgenic Tg[ubb:laconic]lkc1 embryos tails as in (B) with examples of measurements (red dashed line) taken for fin width and length quantification. Pre‐amputation and wound width taken to be from edge to edge of the fin fold just distal to the notochord along the amputation plane; regrowth taken from the end of the notochord to the most distal edge of the fin fold, perpendicular to amputation plane. (E) Graph showing measured fin widths/length in micrometres pre‐, 10 min post‐, and five‐days post‐amputation. Fin length measured from the tip of the notochord to the distal edge of the fin fold. Two‐way ANOVA to calculate significance, n = 25 (control), n = 13 (150 mM oxamate), n = 19 (200 mM oxamate). (F) Graph showing fold change (10 mpa value divided by pre‐amputation value) of Laconic ratio and fin width in micrometres in the first 10 min of amputation with treatment with oxamate or water control. Dotted line on the Y axis marks a fold change of 1 (no change). Two‐way ANOVA to calculate significance, n = 25 (control), n = 13 (150 mM oxamate), n = 19 (200 mM oxamate). All scale bars represent 200 μm. Differences were considered significant to * P < 0.05, ** P < 0.01, *** P < 0.001, **** P < 0.0001, and ns P ≥ 0.05.

Acknowledgments
This image is the copyrighted work of the attributed author or publisher, and ZFIN has permission only to display this image to its users. Additional permissions should be obtained from the applicable author or publisher of the image. Full text @ Wound Repair Regen.