
- Title
-
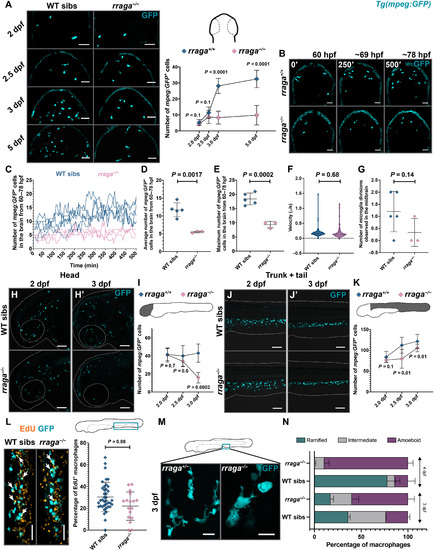
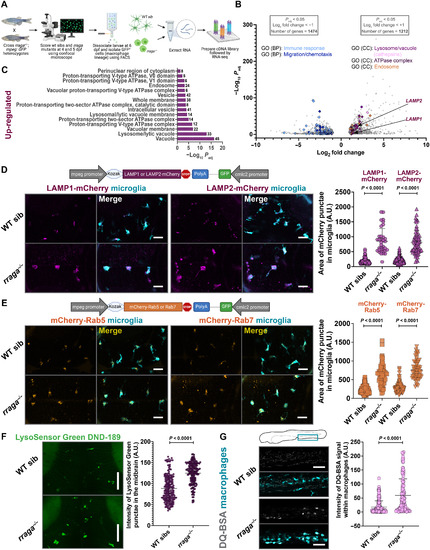
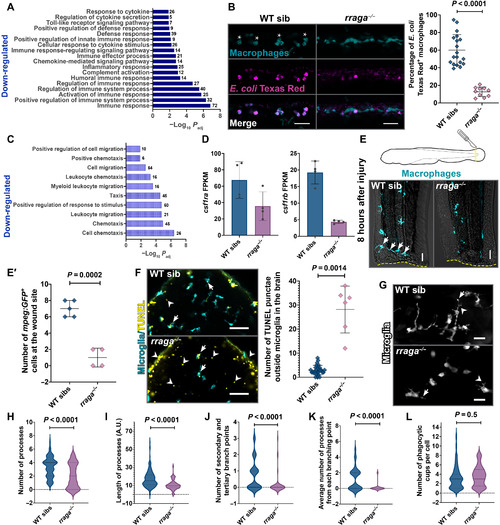
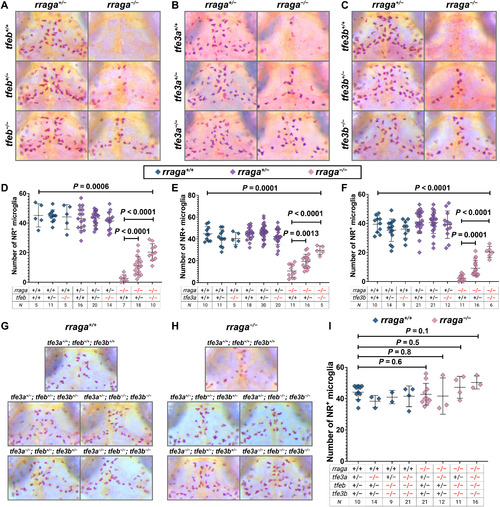
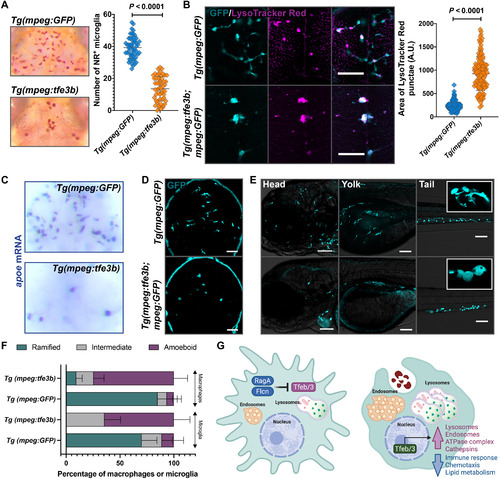
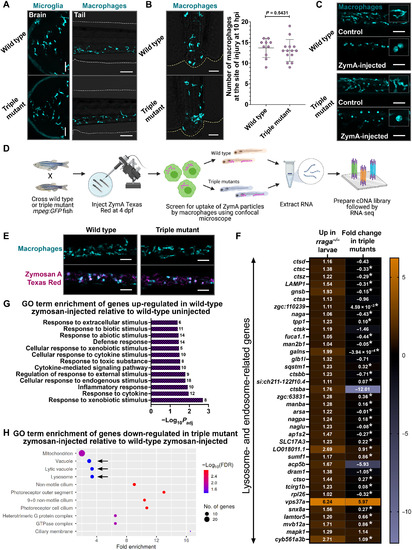
A lysosomal regulatory circuit essential for the development and function of microglia
- Authors
- Iyer, H., Shen, K., Meireles, A.M., Talbot, W.S.
- Source
- Full text @ Sci Adv
|
|
|
PHENOTYPE:
|
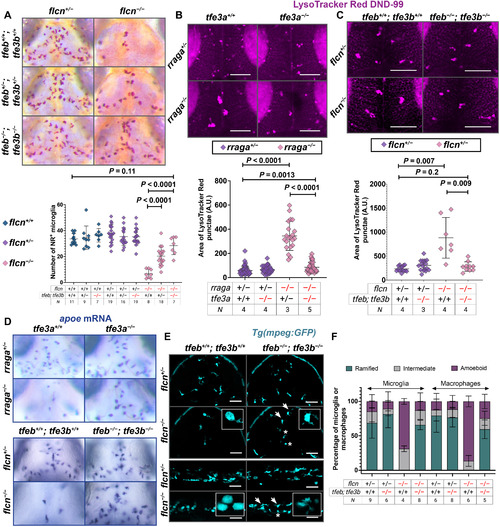
EXPRESSION / LABELING:
PHENOTYPE:
|
|
|