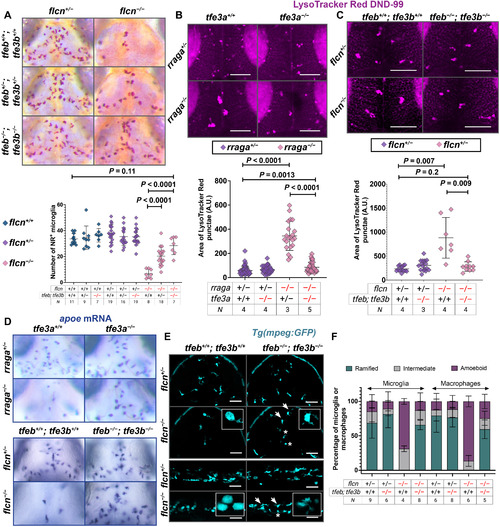
Fig. 5. Simultaneous mutation in tfeb, tfe3a, or tfe3b rescues flcn and rraga mutant phenotypes. (A) NR assay and quantification of microglia in larvae obtained from flcn+/−; tfeb+/−; tfe3b+/− intercross. (B and C) LysoTracker Red assay and quantification of the area of LysoTracker Red punctae in microglia of larvae from (B) rraga+/−; tfe3a+/− intercross and (C) flcn+/−; tfeb+/−; tfe3b+/− intercross. Images show LysoTracker Red signal in dorsal view of the midbrain. Scale bars, 50 μm. Graphs show mean + SD; significance was determined using parametric unpaired t test. (D) apoe mRNA expression at 4 dpf and rescue of microglia in the progeny of rraga+/−; tfe3a+/− intercross and flcn+/−; tfeb+/−; tfe3b+/− intercross. (E) mpeg:GFP expression to visualize microglia and macrophages in flcn; tfeb; tfe3b triple mutants. Arrows denote microglia and macrophages in which ramified morphology has been restored, asterisks denote cells with amoeboid morphology, and insets show magnified views of cell morphology. Scale bars, 50 μm. (F) Quantification of amoeboid morphology and rescue. Graph shows mean + SD; significance was determined using nonparametric Mann-Whitney U test. The number of animals analyzed for each experiment is listed in the tables below each graph; all the panels are representative of at least two independent experiments.
|
