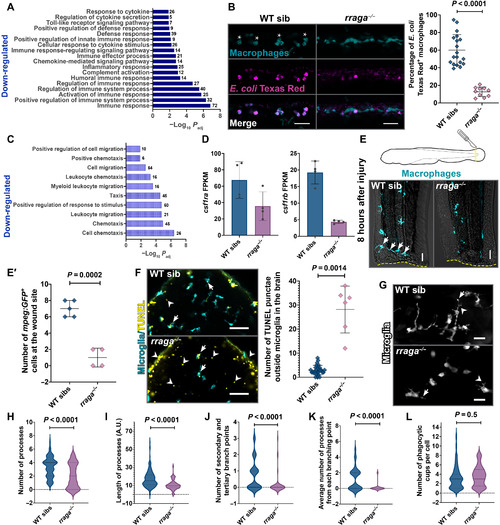
Fig. 3. Macrophages and microglia in rraga mutants show defective clearance of debris. (A) Bar graph showing GO terms related to immune signaling significantly down-regulated in macrophages from rraga mutants. (B) Injection of E. coli Texas Red in rraga mutants and siblings at 4 dpf and corresponding quantification. Wild-type macrophages responding to E. coli become activated and display amoeboid morphology (asterisks). Scale bars, 50 μm. (C) GO terms related to migration/taxis significantly down-regulated in macrophages from rraga mutants. (D) Graphs showing fragments per kilobase of exon per million mapped reads (FPKM) values of csf1ra and csf1rb transcripts in macrophages from rraga mutants; each point represents FPKM value from a single RNA-seq biological replicate. FPKM, fragments per kilobase of exon per million mapped reads. (E and E′) Macrophage response to tail injury at 4 dpf. Arrows in the wild-type image show macrophages at the wound site (yellow dotted line). Scale bars, 20 μm. (F) TUNEL assay and quantification on rraga mutants and their wild-type siblings. Arrows indicate TUNEL+ microglia, and arrowheads indicate TUNEL signal outside microglia. Scale bars, 50 μm. (G to L) Time-lapse imaging and analysis of cellular characteristics of microglia at 5 dpf. (G) Images of rraga mutants and their siblings, with arrows showing phagocytic cup formation and arrowheads showing branching points. Scale bars, 20 μm. All graphs show mean + SD. Significance in (B) was determined using nonparametric Mann-Whitney U test; significance in (E′), (F), and (H) to (L) was determined using parametric unpaired t test. The number of animals analyzed for each experiment is listed in table S1; all the panels are representative of at least two independent experiments.
|
