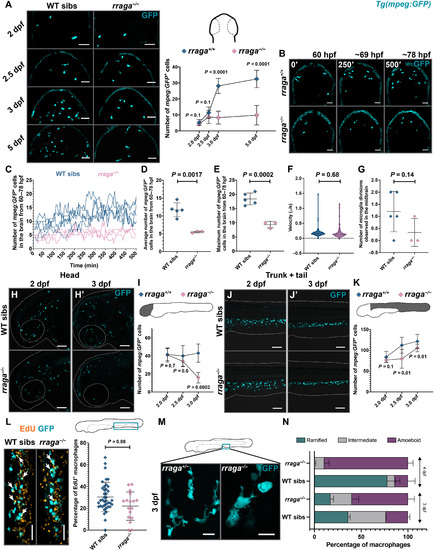
Fig. 1. Defective macrophages in rraga mutants fail to colonize the brain. (A) Dorsal views of the midbrain showing mpeg:GFP expression at the indicated stages along with the corresponding quantification of developing microglia in the midbrain. WT, wild-type. (B) Representative images from time-lapse movies between 60 and ~78 hpf (dorsal views, anterior on top). Images show maximum intensity projections of z-slices at indicated times. (C to G) Quantitative analysis of time-lapse movies. In (C), each line shows macrophage cell counts from a single embryo over time. In (D), (E), and (G), each point represents counts from a single animal. (H to K) Lateral views of peripheral macrophages and quantification in rraga mutants and their siblings. (H, H′, and I) Macrophages in the head and (J, J′, and K) macrophages in the trunk + tail. Graphs in (A), (D) to (G), (I), and (K) show mean + SD; significance was determined using parametric unpaired t test. (L) EdU labeling to determine the percentage of proliferating macrophages in rraga mutants and wild-type siblings. Arrows note colocalization of EdU label with macrophages. Each point in the graph represents percentage of EdU+ macrophages from a single animal. Graph in (L) shows mean + SD; significance was determined using nonparametric Mann-Whitney U test. (M) High-magnification images showing the difference in the morphology of macrophages between rraga mutants and heterozygous animals at 3 dpf. (N) Quantification of amoeboid morphology of macrophages in rraga mutants. Graph in (N) shows mean + SD; significance was determined using nonparametric Mann-Whitney U test. The number of animals analyzed for each experiment is listed in table S1; all the panels are representative of at least two independent experiments. Scale bars, 50 μm.
|
