
- Title
-
Dominantly acting KIF5B variants with pleiotropic cellular consequences cause variable clinical phenotypes
- Authors
- Flex, E., Albadri, S., Radio, F.C., Cecchetti, S., Lauri, A., Priolo, M., Kissopoulos, M., Carpentieri, G., Fasano, G., Venditti, M., Magliocca, V., Bellacchio, E., Welch, C.L., Colombo, P.C., Kochav, S.M., Chang, R., Barrick, R., Trivisano, M., Micalizzi, A., Borghi, R., Messina, E., Mancini, C., Pizzi, S., De Santis, F., Rosello, M., Specchio, N., Compagnucci, C., McWalter, K., Chung, W.K., Del Bene, F., Tartaglia, M.
- Source
- Full text @ Hum. Mol. Genet.
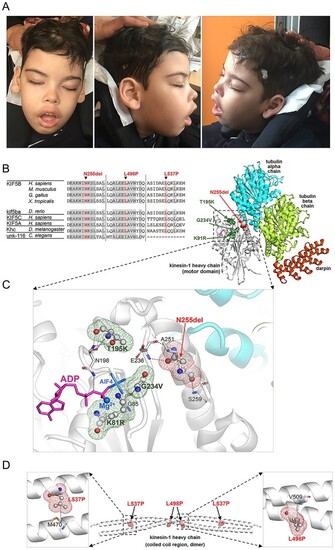
Clinical features of subject 1 and structural data. (A) The subject (8 years) showed hypotonic face, bitemporal narrowing, bushy and straight eyebrow, hypertelorism, long eyelashes, long palpebral fissures, large ears with thick lobe, broad nasal bridge, anteverted nares, short deep philtrum, everted upper lip and prominent upper and lower vermilion. Explicit permission was obtained to publish photographs of the subject. (B) Multiple sequence alignment of KIF5B orthologs and paralogs around the mutated residues. Residues that are invariant (at least down to Drosophila melanogaster) are grayed. (C) The 3D structure of the human kinesin-1 heavy chain motor domain complexed with tubulin and darpin (PDB 4HNA) showing Asn255 (balls and sticks with red meshes), its interactions (dotted lines) with nearby residues (sticks), the co-crystallized ADP (magenta sticks), and Mg2+ cation (blue). The residues mutated in KIF5B-related KD (Lys91, Thr195, and Gly234; balls and sticks with green meshes) are also shown. The pathogenic missense changes are predicted to perturb KIF5B interaction with ATP/ADP. (D) 3D structure of the coiled-coil region (dimeric) of human kinesin-1 heavy chain (PDB 6IGV) including the site affected by the p.Leu498Pro e p.Leu537Pro substitutions (displayed on both monomers). Leu498 in one monomer interacts with Val509 on the bound monomer, while Leu537 on one monomer interacts with Met470 on the bound monomer. |
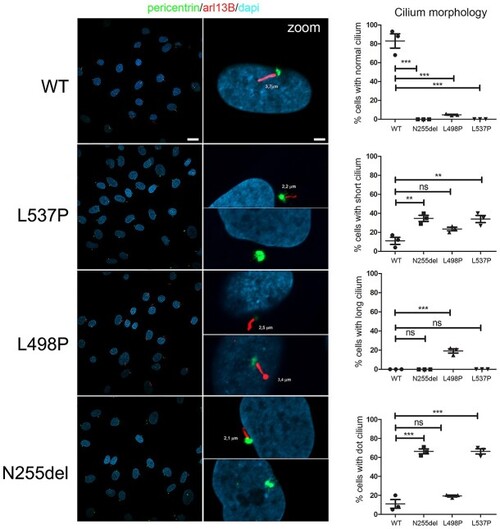
KIF5B variants cause an aberrant primary cilium morphology. Confocal images showing altered primary cilium morphology in patients’ fibroblasts compared to control cells. Specifically, cilia with altered morphology (either short or characterized by a basal body in absence of any visible cilium [dot cilium], zoomed images) were invariably observed in fibroblasts heterozygous for the variants encoding KIF5BLeu537Pro and KIF5BAsn255del. Similarly, primary fibroblasts carrying the KIF5BLeu498Pro protein showed a large proportion of cells having cilia altered in length and thickness (zoomed images). Primary cilia are labeled with ARL13B (red), basal bodies and nuclei are labeled with pericentrin (green) and DAPI (blue), respectively. Scale bars are respectively 10 μm (left) and 2 μm (right). Cells were analyzed for each line over three independent experiments (50 cells/line each) for a total of 150 cells/line scored. P values were calculated by one-way ANOVA with Tukey’s correction for multiple testing. Graph bars show mean ± SEM. |
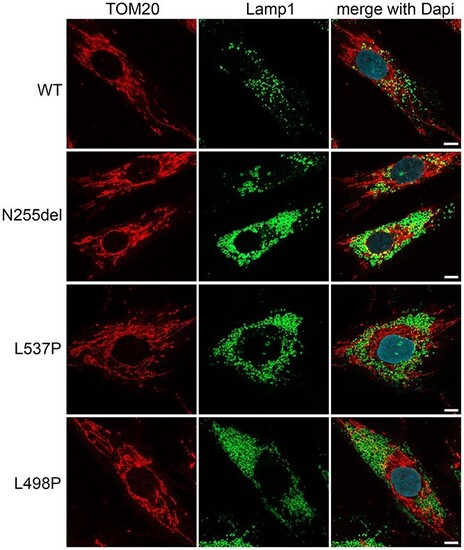
Fibroblasts heterozygous for KIF5B variants show an aberrant morphology of lysosomes and their anomalous pericellular aggregation. Confocal imaging shows morphology and distribution of lysosomes, which are enlarged and more numerous in patients’ cells compared to what is observed in control cells. Their distribution is principally in cell periphery (see also Supplementary Material, Fig. S4). In the same panels staining for mitochondria show no grossly altered distribution and morphology of the mitochondrial network. Scale bar is 5 μm. In these experiments for immunofluorescence analyses cells were stained using antibodies against Lamp1 (lysosome marker, green), TOM20 (mitochondria marker, red) and DAPI (DNA marker, blue). |
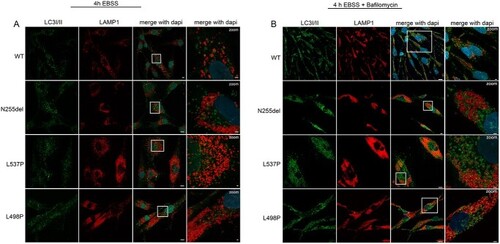
Disease-causing KIF5B mutations affect autophagosomes morphology and subcellular localization. (A) Confocal microscopy analyses show a peculiar subcellular localization of autophagosomes in patients’ cells compared to control cells. In particular, these organelles localize near the nucleus and are enlarged compared to that observed in control cells, and a few number colocalized with lysosomes residing in the peripheral region of the cell. Scale bars are respectively 10 μm (left) and 2 μm (right). (B) In these panels, this behavior is exacerbated by treatment with bafilomycin. Scale bars are respectively 10 μm (left) and 5 μm (right). The cells were stained with antibodies against Lamp1 (lysosomes marker, red), LC3I/II (autophagosomes marker, green) and DAPI (DNA marker, blue). |
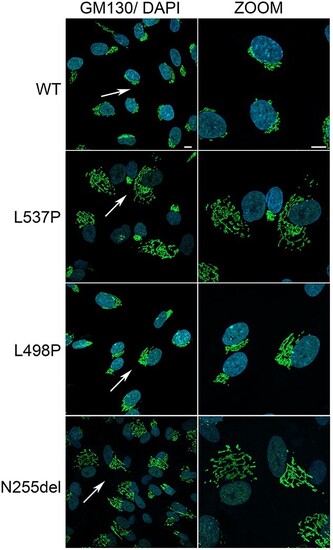
Disease-causing KIF5B mutations affect Golgi network distribution and morphology. Representative confocal images reporting the altered morphology, distribution of Golgi cisternae. Immunofluorescence analysis, performed with anti GM130 (Golgi marker, green) and DAPI (blue), shows Golgi stacks clustered in the perinuclear region in control cells, whereas a scattered pattern of cisternae suggestive of Golgi fragmentation were observed in patients’ cells, with particular evidence in fibroblasts endogenously expressing the KIF5BAsn255del and KIF5Leu537Pro variants. Scale bar is 5 μm. |
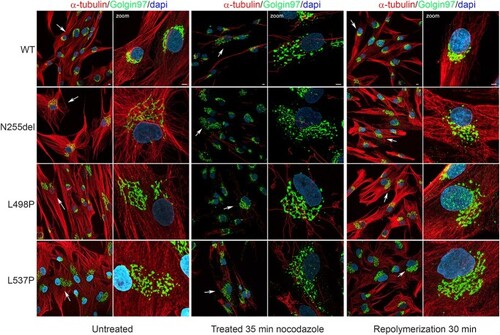
Dependency of Golgi distribution from MTs dynamics. Confocal microscopy analyses show distribution of Golgi cisternae. Images show the perinuclear localization of Golgi in control cell in steady state condition compared to patients’ cell that display a more relaxed Golgi cisternae distribution. Treatment with nocodazole (10 μM) for 35 min promote a substantial MT depolymerization associated with Golgi apparatus fragmentation and dispersion, effect more evident in control cells. After nocodazole washed-out MT were allowed to re-polymerize in a nocodazole free medium for 30 min. Panels show the control MT network normally organized associated to complete re-clustering of Golgi elements in a perinuclear region, unlike the patients’ cells showing a more relaxed Golgi apparatus and a disorganized MT network. This experiment indicates that MTs play a role in maintaining the integrity and location of the Golgi apparatus in cells in interphase. After detergent-extraction in PEM buffer, cells were fixed with ice methanol and then stained with anti-α-tubulin antibody (red), anti Golgin 97 (Golgi marker, green) and DAPI (blue). Scale bar is 5 μm. |
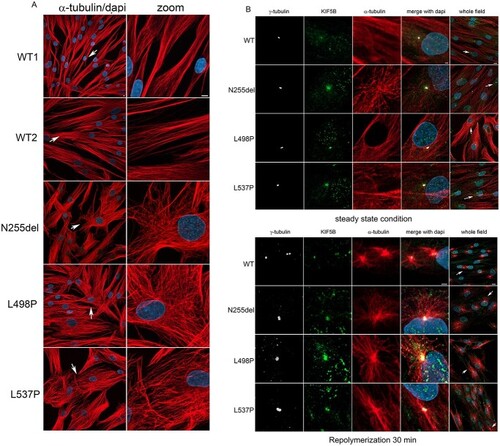
Defective KIF5B function impacts MT orientation and cell shape and localize to MTOC during MT repolymerization as well as in interphase. (A) Confocal microscopy analyses show an evident aberrant orientation of MT in patients’ cells in interphase compared to control cells. Scale bar is 5 μm (B) Panel show a colocalization of KIF5B with the MTOC. In patients’ cells this colocalization is evident during MT repolymerization but persist during cell interphase. In WT cells, it is more evident during MT repolymerization and less in cells in steady state condition. This experiment suggests a role of KIF5B on microtubular dynamics. Scale bar is 2 μm (zoomed images) and 10 μm (whole field) respectively. Cells were stained with anti-α-tubulin antibody (MT marker, red), anti-γ-tubulin (MTOC marker, white), KIF5B (green) and DAPI (blue). |
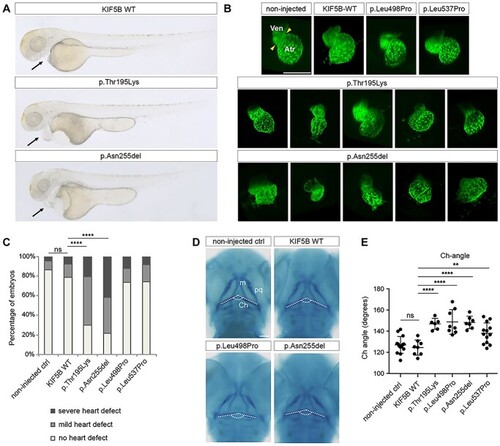
KIF5B is important for proper heart formation and contributes to craniofacial development in zebrafish. (A) Representative images of KIF5B variant-injected embryos for the different morphological classes of heart defects (from top to bottom, no defects, mild and severe defects). (B) Confocal imaging of Tg(cmlc2:eGFP) zebrafish transgenic hearts at 2 days post-fertilization (dpf). At this stage the zebrafish heart is formed by two chambers, the ventricule (Ven) and the atrium (Atr) separated by a contractile ring (yellow arrowheads). Injected transgenic embryos with the different KIF5B variants at 1-cell stage were imaged at 2 dpf, revealing heart formation defects specifically in embryos expressing KIF5BAsn255del variants. Scale bars: 150 μm. (C) Heart defects quantification of 2 dpf larvae injected with KIF5B alleles. With respect to non-injected controls and wild type KIF5B-injected embryos, larvae injected with the KIF5BAsn255del and the KIF5Bp.Thr195Lys variants show a significant increase in the number of embryos with mild and severe heart defects. (****) P-value < 0.0001. Ven: ventricle, Atr: atrium. (D) Alcian blue staining at 3 dpf of zebrafish larvae injected at 1-cell stage with (top. right) wild-type KIF5B (bottom, left) KIF5BLeu495Pro (bottom, right) KIF5BAsn255del, compared to the non-injected larvae (top, left). White dashed lines label the ceratohyal cartilages. (E) The ceratohyal angle (Ch-angle) for each condition was measured, revealing a wider angle at the ceratohyal cartilage intersection for all injected variants compared to non-injected control larvae or wild-type KIF5B. ch: ceratohyal; m: Meckel’s; pq: palatoquadrate. (**) P-value = 0.0081 and (****) < 0.0001. Scale bars: 100 μm. |
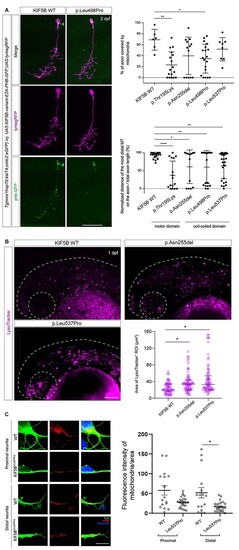
KIF5B variants affect lysosomes organization in zebrafish, and motoneuron mitochondrial transport in zebrafish and iPSC-derived motoneurons. (A) DNA constructs containing the different KIF5B variants cloned under the inducible UAS cassettes, the mitochondria labeling protein phb-GFP and membrane labeling tag lynRFP (UAS:KIF5B-variant-E2A-PHB-GFP;UAS:lyntagRFP) were injected in the transgenic line Tg(mnx1-hsp70:kalT4;cmlc2:eGFP) at 1-cell stage. In this line, the mnx1 promoter triggers the expression of the injected construct specifically in motoneurons. The motoneuron membrane is labeled by lyntagRFP (magenta), and mitochondria are stained by phb-GFP (green). Scale bar: 50 μm (left panels). Quantification of proportion of motoneuron axon covered by mitochondrial signal (GFP/lyntagRFP signal). Both KIF5BThr195Lys and KIF5BLeu498Pro variants display significant decrease in mitochondria coverage defects compared to KIF5BWT, KIF5BAsn255del and KIF5BLeu537Pro injected variants. (*) P-value = 0.0423 for KIF5BLeu498Pro variant and (**) P-value = 0.0038 for KIF5Bp.Thr195Lys variant (right upper panel). The distance between the cell body and the most distal detected mitochondria along the motoneuron axon was measured and normalized to the total axon length. All injected KIF5B variants display mitochondria displacement defects compared to the KIF5B WT injected variant. (****) P-value < 0.0001 for KIF5Bp.Thr195Lys variant, (**) P-value = 0.0037 for KIF5BLeu498Pro variant, (**) P-value = 0.0058 for KIF5BLeu537Pro variant and (*) P-value = 0.0146 for KIF5BAsn255del variant (right bottom panel). (B) Representative images showing confocal maximum intensity Z projections of zebrafish embryos at around 30 h post-fertilization (hpf) injected at 1-cell stage with KIF5BWT, KIF5BAsn255del and KIF5BLeu537Pro mRNAs and stained with LysoTracker Red DND-99. Dotted lines and circles indicate the head region and the eye, respectively. Asterisks indicate autofluorescence in the yolk tissue. Scale bar: 100 μm. The scatter plot shows the area of all the LysoTracker positive ROIs together analyzed in the head region of different animals in the different experimental groups (N = 8 for KIF5BWT and KIF5BLeu537Pro, N = 9 for KIF5BAsn255del), median with interquartile range of the pooled data are shown for each experimental grouped. Compared to KIF5BWT injected embryos, larvae injected with the variants KIF5BAsn255del and KIF5BLeu537Pro show a significant increase in lysosomes’ size, (*) P-value < 0.05. (C) Immunofluorescence microscopy analysis (left panels) showing staining for anti-TUJ1 antibody (green) and anti-mitochondria (red) in motoneurons differentiated from iPSC clones obtained from primary fibroblasts from Subject 1 (p.Leu537Pro) and an age- and sex-matched healthy control (WT). Scale bar = 5 μm. The bar graph (right panel) shows the quantification of the mitochondria-specific signal (anti-mitochondria antibody) normalized over the neurite’s area analyzed. Data are presented as mean ± SEM, n = 3. *P-value<0.05, according to Mann-Whitney test. |