
Fig. 9
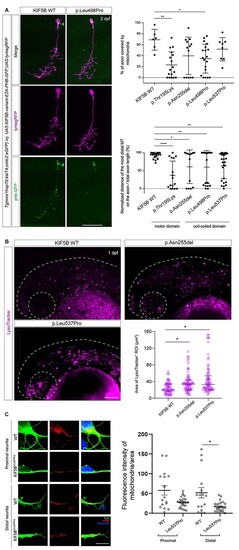
KIF5B variants affect lysosomes organization in zebrafish, and motoneuron mitochondrial transport in zebrafish and iPSC-derived motoneurons. (A) DNA constructs containing the different KIF5B variants cloned under the inducible UAS cassettes, the mitochondria labeling protein phb-GFP and membrane labeling tag lynRFP (UAS:KIF5B-variant-E2A-PHB-GFP;UAS:lyntagRFP) were injected in the transgenic line Tg(mnx1-hsp70:kalT4;cmlc2:eGFP) at 1-cell stage. In this line, the mnx1 promoter triggers the expression of the injected construct specifically in motoneurons. The motoneuron membrane is labeled by lyntagRFP (magenta), and mitochondria are stained by phb-GFP (green). Scale bar: 50 μm (left panels). Quantification of proportion of motoneuron axon covered by mitochondrial signal (GFP/lyntagRFP signal). Both KIF5BThr195Lys and KIF5BLeu498Pro variants display significant decrease in mitochondria coverage defects compared to KIF5BWT, KIF5BAsn255del and KIF5BLeu537Pro injected variants. (*) P-value = 0.0423 for KIF5BLeu498Pro variant and (**) P-value = 0.0038 for KIF5Bp.Thr195Lys variant (right upper panel). The distance between the cell body and the most distal detected mitochondria along the motoneuron axon was measured and normalized to the total axon length. All injected KIF5B variants display mitochondria displacement defects compared to the KIF5B WT injected variant. (****) P-value < 0.0001 for KIF5Bp.Thr195Lys variant, (**) P-value = 0.0037 for KIF5BLeu498Pro variant, (**) P-value = 0.0058 for KIF5BLeu537Pro variant and (*) P-value = 0.0146 for KIF5BAsn255del variant (right bottom panel). (B) Representative images showing confocal maximum intensity Z projections of zebrafish embryos at around 30 h post-fertilization (hpf) injected at 1-cell stage with KIF5BWT, KIF5BAsn255del and KIF5BLeu537Pro mRNAs and stained with LysoTracker Red DND-99. Dotted lines and circles indicate the head region and the eye, respectively. Asterisks indicate autofluorescence in the yolk tissue. Scale bar: 100 μm. The scatter plot shows the area of all the LysoTracker positive ROIs together analyzed in the head region of different animals in the different experimental groups (N = 8 for KIF5BWT and KIF5BLeu537Pro, N = 9 for KIF5BAsn255del), median with interquartile range of the pooled data are shown for each experimental grouped. Compared to KIF5BWT injected embryos, larvae injected with the variants KIF5BAsn255del and KIF5BLeu537Pro show a significant increase in lysosomes’ size, (*) P-value < 0.05. (C) Immunofluorescence microscopy analysis (left panels) showing staining for anti-TUJ1 antibody (green) and anti-mitochondria (red) in motoneurons differentiated from iPSC clones obtained from primary fibroblasts from Subject 1 (p.Leu537Pro) and an age- and sex-matched healthy control (WT). Scale bar = 5 μm. The bar graph (right panel) shows the quantification of the mitochondria-specific signal (anti-mitochondria antibody) normalized over the neurite’s area analyzed. Data are presented as mean ± SEM, n = 3. *P-value<0.05, according to Mann-Whitney test. |