
Fig. 6
- ID
- ZDB-IMAGE-230627-6
- Publication
- Flex et al., 2022 - Dominantly acting KIF5B variants with pleiotropic cellular consequences cause variable clinical phenotypes
- All Figures
- Figures for Flex et al., 2022
|
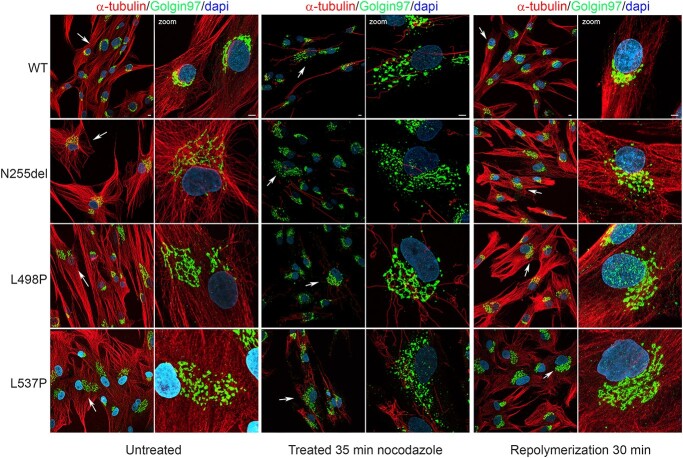
Fig. 6
Dependency of Golgi distribution from MTs dynamics. Confocal microscopy analyses show distribution of Golgi cisternae. Images show the perinuclear localization of Golgi in control cell in steady state condition compared to patients’ cell that display a more relaxed Golgi cisternae distribution. Treatment with nocodazole (10 μM) for 35 min promote a substantial MT depolymerization associated with Golgi apparatus fragmentation and dispersion, effect more evident in control cells. After nocodazole washed-out MT were allowed to re-polymerize in a nocodazole free medium for 30 min. Panels show the control MT network normally organized associated to complete re-clustering of Golgi elements in a perinuclear region, unlike the patients’ cells showing a more relaxed Golgi apparatus and a disorganized MT network. This experiment indicates that MTs play a role in maintaining the integrity and location of the Golgi apparatus in cells in interphase. After detergent-extraction in PEM buffer, cells were fixed with ice methanol and then stained with anti-α-tubulin antibody (red), anti Golgin 97 (Golgi marker, green) and DAPI (blue). Scale bar is 5 μm.