
- Title
-
Evaluation of Locomotion Complexity in Zebrafish after Exposure to Twenty Antibiotics by Fractal Dimension and Entropy Analysis
- Authors
- Suryanto, M.E., Yang, C.C., Audira, G., Vasquez, R.D., Roldan, M.J.M., Ger, T.R., Hsiao, C.D.
- Source
- Full text @ Antibiotics (Basel)
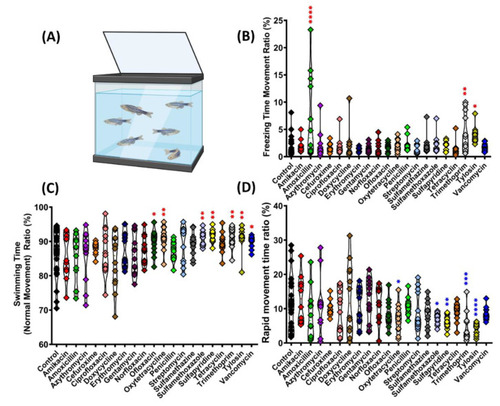
Comparison of swimming movement activity of golden zebrafish after 10 days exposure with different antibiotics in 3D locomotion test. (A) Outlooking of 3D locomotion testing tank; (B) freezing movement time ratio; (C) swimming time ratio; and (D) rapid movement time ratio. The data were analyzed by ordinary one-way ANOVA followed by Dunnett’s multiple comparison test (n control: 24, n for each antibiotic group: 12). The significances were indicated by * p < 0.05; ** p < 0.01; *** p < 0.001; **** p < 0.0001 (red asterisk indicates a higher mean value, while blue asterisk indicates a lower mean value than the control). |
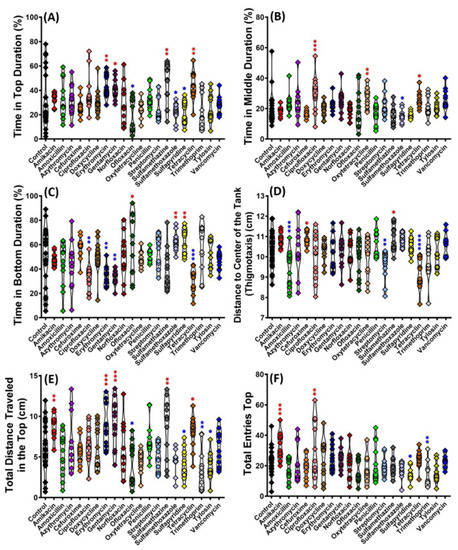
Comparison of exploratory behavior of golden zebrafish after 10 days exposure with different antibiotics in 3D locomotion test. (A) Time in top area, (B) time in middle area, (C) time in bottom area, (D) distance to the center of the tank, (E) total distance traveled in the top area, and (F) total entries in the top area. The data were analyzed by ordinary one-way ANOVA followed by multiple comparison Fisher’s LSD test (n control: 24, n for each antibiotic group: 12). The significances were indicated by * p < 0.05; ** p < 0.01; *** p < 0.001; **** p < 0.0001 (red asterisk indicates a higher mean value, while blue asterisk indicates a lower mean value than the control). |
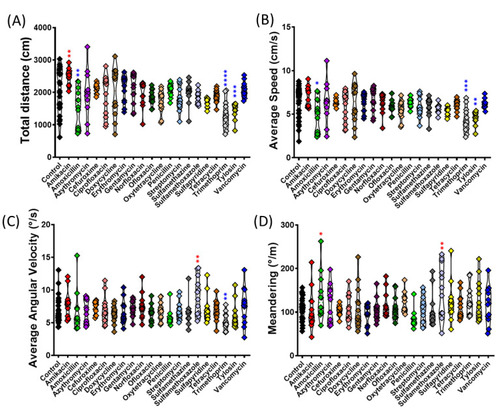
Comparison of locomotor activity endpoints of golden zebrafish after 10 days exposure with different antibiotics in 3D locomotion test. (A) Total distance; (B) average speed; (C) average angular velocity; and (D) meandering. The data were analyzed by ordinary one-way ANOVA followed by multiple comparison Fisher’s LSD test (n control: 24, n for each antibiotic group: 12). The significances were indicated by * p < 0.05; ** p < 0.01; *** p < 0.001; **** p < 0.0001 (red asterisk indicates a higher mean value, while blue asterisk indicates a lower mean value than control). |
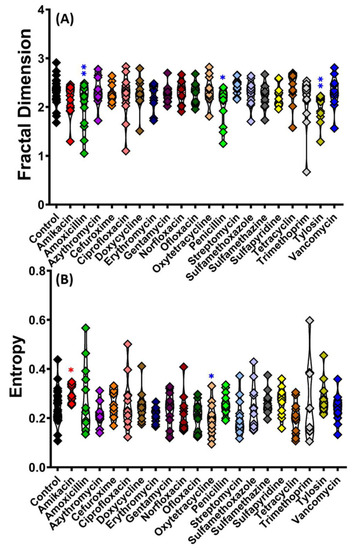
Comparison of (A) fractal dimension (FD) and (B) entropy value in golden zebrafish locomotion after 10 days exposure with different antibiotics in 3D locomotion test. The data were analyzed by ordinary one-way ANOVA followed by multiple comparison Fisher’s LSD test (n control: 24, n for each antibiotic group: 12). The significances were indicated by * p < 0.05; ** p < 0.01 (red asterisk indicates a higher mean value, while blue asterisk indicates a lower mean value than control). |
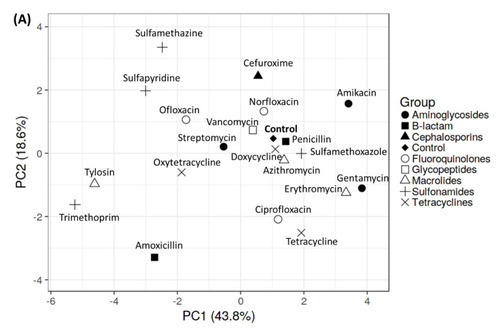
Principal component (PCA) and hierarchical clustering analysis based on multiple behavior endpoints in golden zebrafish after 10 days exposure to different antibiotics. (A) PCA projects all behavior endpoints to explore the relationships in data among the antibiotic-treated/non-treated group. (B) Hierarchical clustering analysis of different behavior activity post-antibiotic treatment groups. Red indicates higher score of behavior endpoint, whereas blue indicates lower score of behavior endpoint. |
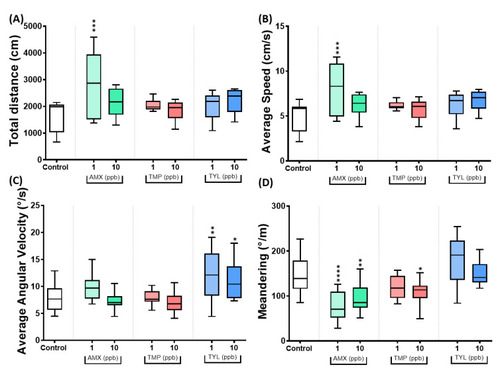
The locomotor activity endpoints of control and antibiotic-treated golden zebrafish after 10 days exposure. (A) Total distance traveled (cm); (B) average speed (cm/s); (C) average angular velocity (°/s); and (D) meandering movement (°/m). The data are expressed as mean ± S.E.M and were analyzed by ordinary one-way ANOVA followed by Dunnett’s test (n control: 12, n for antibiotic groups: 12, except n for AMX 1 ppb and TMP 10 ppb: 11, and n TYL 10 ppb: 10). The significances were indicated by * p < 0.05; ** p < 0.01, *** p < 0.001, and **** p < 0.0001 when compared to control group. |
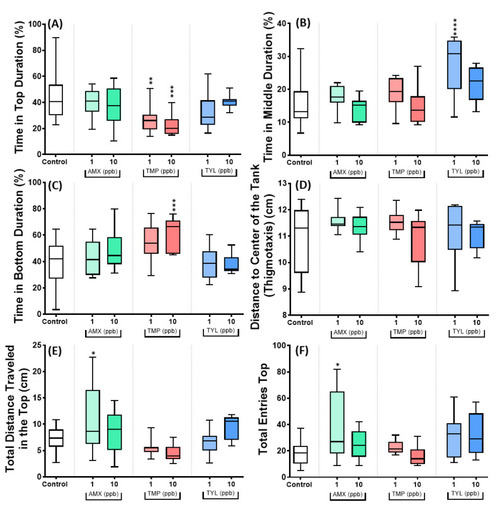
The exploratory behavior of control and antibiotic-treated golden zebrafish after 10 days of exposure. (A) Time in top duration (%); (B) time in middle duration (%); (C) time in bottom duration (%); (D) distance to the center of the tank (thigmotaxis) (cm); (E) total distance traveled in the top (cm); and (F) total entries top. The data are expressed as mean ± S.E.M and were analyzed by one-way ANOVA followed by Dunnett’s test (n control: 12, n for antibiotic groups: 12, except n for AMX 1 ppb and TMP 10 ppb: 11, and n TYL 10 ppb: 10). The significances were indicated by * p < 0.05; ** p < 0.01, *** p < 0.001, and **** p < 0.0001 when compared to control group. |