
Image
|
Figure Caption
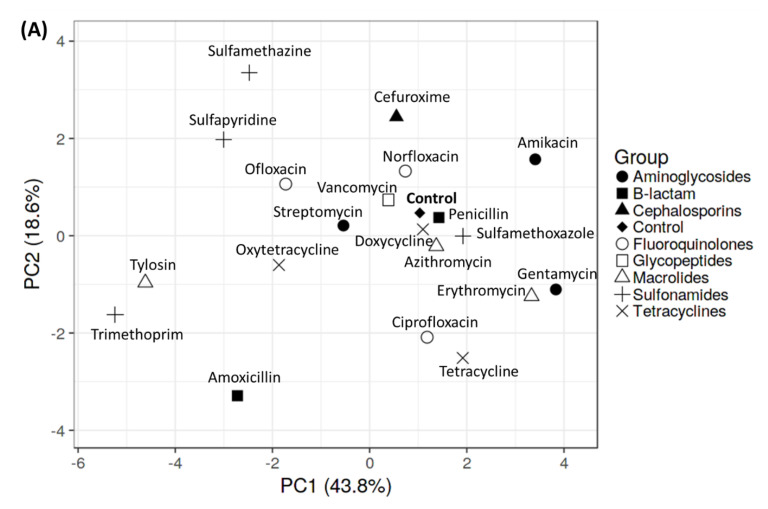
Fig. 5
Principal component (PCA) and hierarchical clustering analysis based on multiple behavior endpoints in golden zebrafish after 10 days exposure to different antibiotics. (A) PCA projects all behavior endpoints to explore the relationships in data among the antibiotic-treated/non-treated group. (B) Hierarchical clustering analysis of different behavior activity post-antibiotic treatment groups. Red indicates higher score of behavior endpoint, whereas blue indicates lower score of behavior endpoint.
Acknowledgments
This image is the copyrighted work of the attributed author or publisher, and
ZFIN has permission only to display this image to its users.
Additional permissions should be obtained from the applicable author or publisher of the image.
Full text @ Antibiotics (Basel)