
|
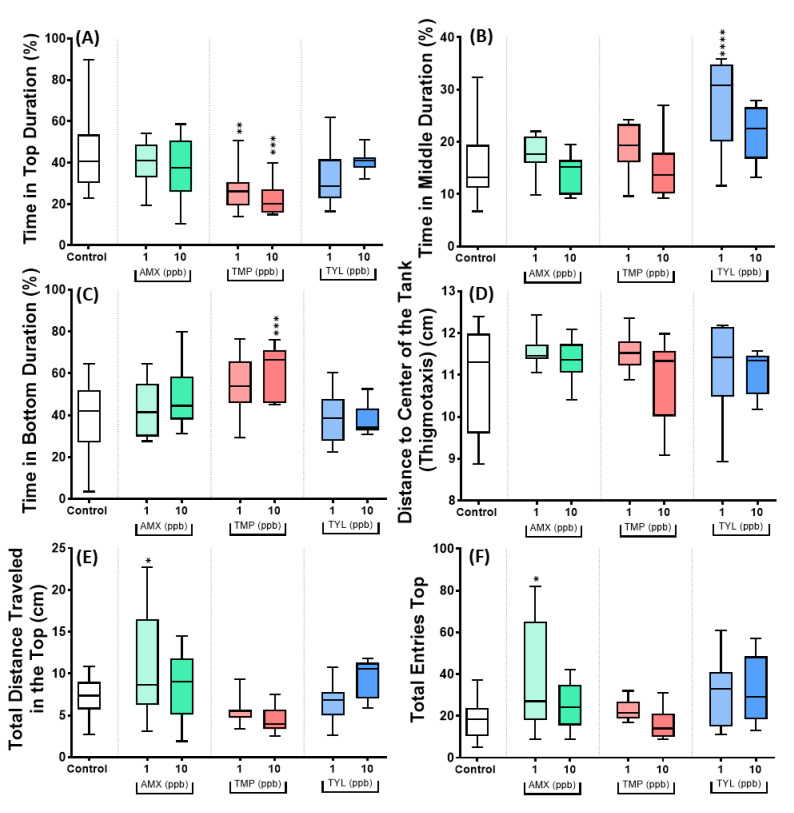
Fig. 7
The exploratory behavior of control and antibiotic-treated golden zebrafish after 10 days of exposure. (A) Time in top duration (%); (B) time in middle duration (%); (C) time in bottom duration (%); (D) distance to the center of the tank (thigmotaxis) (cm); (E) total distance traveled in the top (cm); and (F) total entries top. The data are expressed as mean ± S.E.M and were analyzed by one-way ANOVA followed by Dunnett’s test (n control: 12, n for antibiotic groups: 12, except n for AMX 1 ppb and TMP 10 ppb: 11, and n TYL 10 ppb: 10). The significances were indicated by * p < 0.05; ** p < 0.01, *** p < 0.001, and **** p < 0.0001 when compared to control group.