
|
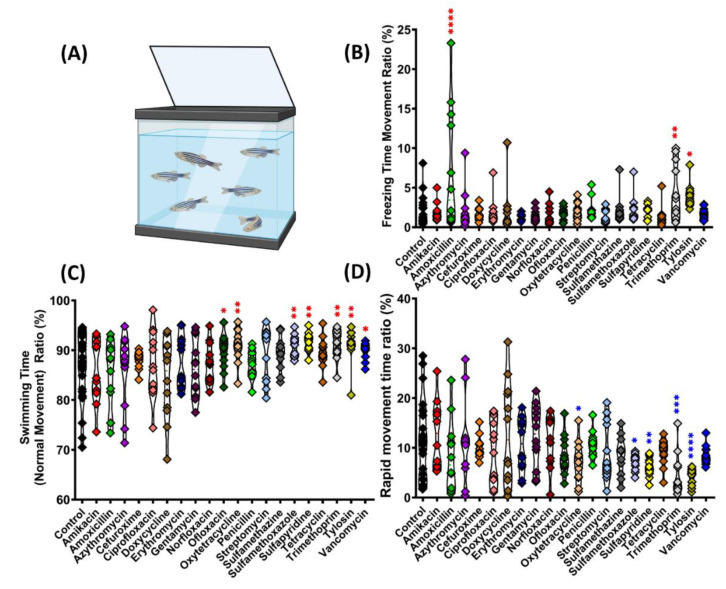
Fig. 1
Comparison of swimming movement activity of golden zebrafish after 10 days exposure with different antibiotics in 3D locomotion test. (A) Outlooking of 3D locomotion testing tank; (B) freezing movement time ratio; (C) swimming time ratio; and (D) rapid movement time ratio. The data were analyzed by ordinary one-way ANOVA followed by Dunnett’s multiple comparison test (n control: 24, n for each antibiotic group: 12). The significances were indicated by * p < 0.05; ** p < 0.01; *** p < 0.001; **** p < 0.0001 (red asterisk indicates a higher mean value, while blue asterisk indicates a lower mean value than the control).