
|
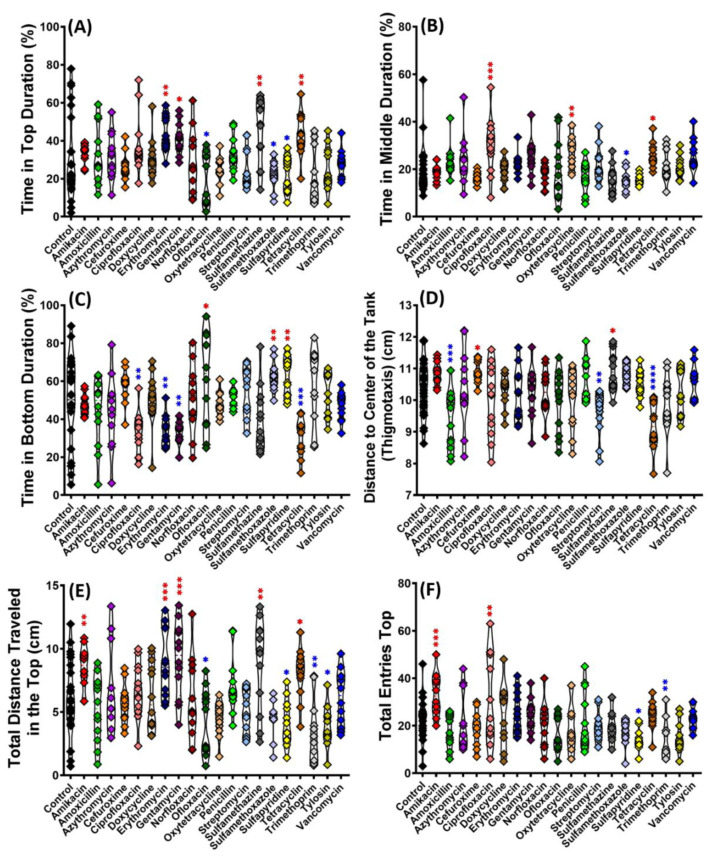
Fig. 2
Comparison of exploratory behavior of golden zebrafish after 10 days exposure with different antibiotics in 3D locomotion test. (A) Time in top area, (B) time in middle area, (C) time in bottom area, (D) distance to the center of the tank, (E) total distance traveled in the top area, and (F) total entries in the top area. The data were analyzed by ordinary one-way ANOVA followed by multiple comparison Fisher’s LSD test (n control: 24, n for each antibiotic group: 12). The significances were indicated by * p < 0.05; ** p < 0.01; *** p < 0.001; **** p < 0.0001 (red asterisk indicates a higher mean value, while blue asterisk indicates a lower mean value than the control).