
FIGURE
Fig. 3
- ID
- ZDB-FIG-220829-172
- Publication
- Suryanto et al., 2022 - Evaluation of Locomotion Complexity in Zebrafish after Exposure to Twenty Antibiotics by Fractal Dimension and Entropy Analysis
- Other Figures
- All Figure Page
- Back to All Figure Page
Fig. 3
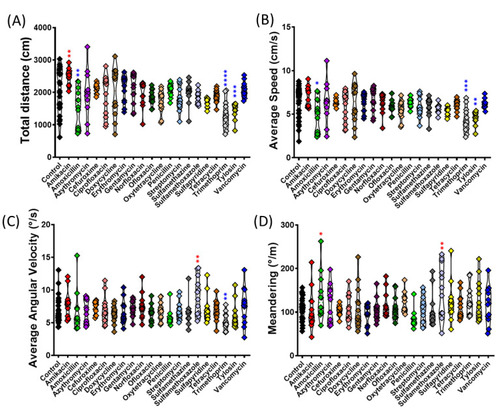
Comparison of locomotor activity endpoints of golden zebrafish after 10 days exposure with different antibiotics in 3D locomotion test. (A) Total distance; (B) average speed; (C) average angular velocity; and (D) meandering. The data were analyzed by ordinary one-way ANOVA followed by multiple comparison Fisher’s LSD test (n control: 24, n for each antibiotic group: 12). The significances were indicated by * p < 0.05; ** p < 0.01; *** p < 0.001; **** p < 0.0001 (red asterisk indicates a higher mean value, while blue asterisk indicates a lower mean value than control). |
Expression Data
Expression Detail
Antibody Labeling
Phenotype Data
Phenotype Detail
Acknowledgments
This image is the copyrighted work of the attributed author or publisher, and
ZFIN has permission only to display this image to its users.
Additional permissions should be obtained from the applicable author or publisher of the image.
Full text @ Antibiotics (Basel)