
- Title
-
Banp regulates DNA damage response and chromosome segregation during the cell cycle in zebrafish retina
- Authors
- Babu, S., Takeuchi, Y., Masai, I.
- Source
- Full text @ Elife
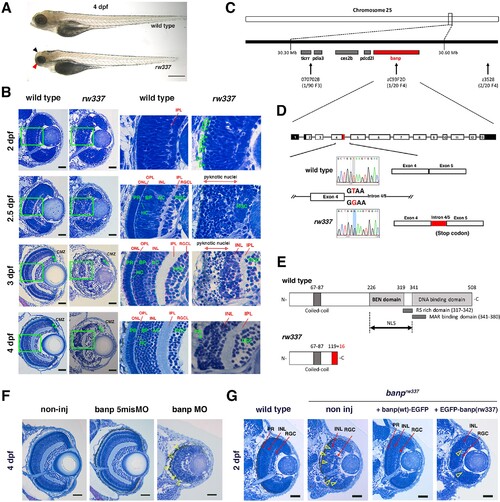
(A) Morphology of wild-type and rw337 mutant embryos at 4 dpf. rw337 mutant embryos have smaller eyes compared to wild type at 4 dpf (red arrow). The black arrow shows the cloudy tectum in rw337 mutant embryos, representing cell death. Scale bars: 100 μm. (B) Plastic sections of wild-type and rw337 mutant retinas during development. Higher magnification images of green squares in the left columns are shown in the right columns. Retinal neuroepithelium is normal in rw337 mutants until 2 dpf. However, many round cells reminiscent of mitotic cells are accumulated in the apical region of rw337 mutant retinas at 2 dpf (open green arrowheads), suggesting mitotic defects in retinal progenitor cells. In wild-type retinas, three nuclear layers (RGCL, INL, and ONL) and two plexiform layers (IPL and OPL) are formed at 2.5 dpf. INL consists of amacrine cells (ACs), bipolar cells (BPs), and horizontal cells (HCs). ONL consists of two types of photoreceptors (PRs), rods and cones. However, only RGCs appear near the lens and the outer region was occupied by pyknotic nuclei, indicating dead cells in rw337 mutants. At 3 dpf, INL is formed, but the outer region is still occupied by pyknotic nuclei in rw337 mutants. At 4 dpf, pyknotic nuclei are reduced in rw337 mutants; however, ONL and OPL are absent despite the small number of photoreceptor-like columnar cells in putative INL (PR, asterisks). At 3 and 4 dpf, the CMZ is maintained in rw337 mutants (green double asterisks). (C) The rw337 mutation is mapped in the genomic region flanked by two polymorphic markers, 070702B and zC93F2D, on chromosome 25. This genomic region contains four genes, including banp. (D) banp cDNA consists of 13 exons. In rw337 mutants, T at the donor splice site of the intron between exons 4 and 5 (intron4/5) is converted to G, leading to the insertion of 52 nucleotides (red region) from intron 4/5. A new stop codon appears within this insertion. (E) Wild-type Banp protein has a coiled-coil domain, a BEN domain and a DNA-binding domain. An NLS domain, an RS-rich domain, and MAR-binding domain are shown. A truncated protein missing BEN and DNA-binding domains is predicted in rw337 mutants. (F) Retinal sections of wild-type, wild-type embryos injected with banp-5misMO, and banp MO. banp morphant retinas have similar phenotypes to banprw337 mutants, with increased cell death and loss of the ONL. Yellow open arrowheads show pyknotic nuclei. (G) Retinal sections of wild-type retinas, banprw337 mutant retinas, and banprw337 mutant retinas overexpressing Banp(wt)-EGFP and EGFP-Banp(rw337). Overexpression of Banp(wt)-EGFP inhibits cell death and recovers retinal lamination in banprw337 mutants, whereas overexpression of EGFP-Banp(rw337) does not inhibit retinal defects in banprw337 mutants. Yellow open arrowheads indicate pyknotic cells in banprw337 mutant retinas and banprw337 mutant retinas overexpressing EGFP-Banp(rw337). Scale bars: 20 μm for (B, F, G).RGC, retinal ganglion cell; AC, amacrine cell, BP, bipolar cell; HC, horizontal cell; PR, photoreceptor; OPL, outer plexiform layer; IPL, inner plexiform layer; ONL, outer nuclear layer; INL, inner nuclear layer; RGCL, retinal ganglion cell layer; CMZ, ciliary marginal zone.
|
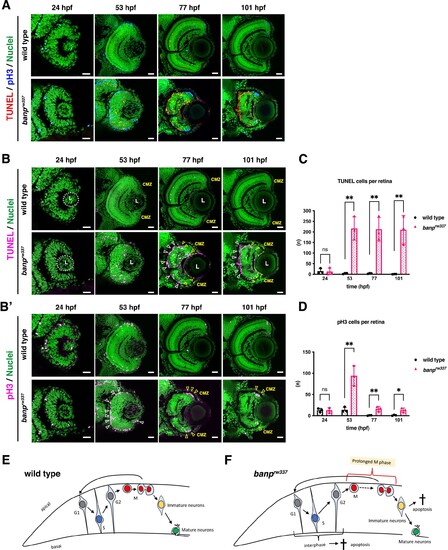
(A) Double labeling of wild-type (upper) and banprw337 mutant (lower) retinas with TUNEL (red) and anti-pH3 antibody (blue). Nucleus was counterstained with Sytoxgreen (green). (B) Only TUNEL and nuclear fluorescent channel of images shown in (A). TUNEL and nuclear staining are indicated in magenta and green, respectively. In banprw337 mutants, apoptotic cells start to be observed in neural retinas at 53 hpf, and increase in the apical region of retinas (white arrowheads) and at the interface between the CMZ and the central retina (yellow open arrowheads) at 77 and 101 hpf. (B’) Only pH3 and nuclear fluorescent channel of images shown in (A). pH3 signals and nuclear staining are indicated in magenta and green, respectively. Mitotic cells are accumulated at the apical surface of banprw337 mutant retinas at 53 hpf (white open arrowheads) and restricted in the apical region of the CMZ (yellow open arrow) at 77 and 101 hpf. (C) The number of TUNEL-positive cells per retina. Apoptosis is significantly increased in banprw337 mutants after 53 hpf. Unpaired t-test, two-tailed, Mean ± SD. [n=3, p**<0.01] (D) The number of pH3-positive cells per retina. The number of mitotic cells is significantly increased in banprw337 mutants at 53 hpf. The number is decreased, but still significantly higher in banprw337 mutants than in wild-type siblings after 77 hpf. Unpaired t-test, two-tailed, Mean ± SD. [n=3, p**<0.01] (E) Schematic diagram of wild-type retinas. Retinal progenitor cells undergo cell-cycle progression in which the nuclei move along the apico-basal axis depending on cell-cycle phase (the most basal location in S phase and the most apical location in M phase), called interkinetic nuclear migration. Mitosis occurs in the apical surface of the neural retina. Daughter cells reenter the cell cycle as retinal progenitor cells or start to differentiate into postmitotic neurons, which migrate into the basal region and become mature neurons. (F) Schematic diagram of banprw337 mutant retinas. A fraction of interphase progenitor cells (G1, S, or G2 phase cells) undergo apoptosis after 48 hpf. Mitotic cells are accumulated at the apical surface, which may be caused by prolonged mitotic duration. A fraction of immature differentiating neurons also undergo apoptosis. Thus, banprw337 mutant retinal cells show multiple defects in cell-cycle progression of retinal progenitor cells and retinal neurogenesis. Scale bars: 20 μm for (A, B, B’).
|
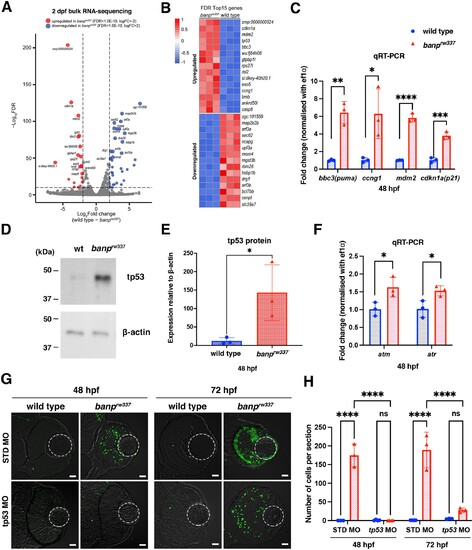
(A) A volcano plot indicating gene differential expression of 48 hpf wild-type versus banprw337 mutant embryos. Red dots show genes that were upregulated ≥2 fold in mutants, while blue dots represent genes downregulated ≥2 fold. (B) Heat map of the top 15 differentially expressed genes. (C) Relative mRNA expression levels for bbc3, ccng1, mdm2, cdkn1a in wild type and banprw337 mutants. Quantitative RT-PCR confirmed the up-regulation of p53 pathway genes in banprw337 mutants at 48 hpf. Unpaired t-test (two-tailed), Mean ± SD. [n=3, p*<0.05, p**<0.01, p***<0.001, p****<0.0001]. (D) Western blotting of wild-type and banprw337 mutants with anti-tp53 antibody. Full-length tp53 protein is stabilized in banprw337 mutants, compared to wild type. β-actin protein is an endogenous control and used for normalization of tp53 protein level. (E) Quantification of tp53 protein level relative to a control protein, β-actin, in wild-type and banprw337 mutants. The tp53 protein level is significantly higher in banprw337 mutants than in wild type at 48 hpf. Unpaired t-test (two-tailed), Mean ± SD. [n=3, p*<0.05]. (F) Relative mRNA expression levels for atm and atr in wild type and banprw337 mutants. Both mRNAs are significantly up-regulated in banprw337 mutants at 48 hpf. Unpaired t-test (two-tailed) [n=3, p*<0.05]. (G) TUNEL of wild-type and banprw337 mutant retinas injected with STD MO and tp53 MO at 48 hpf and 72 hpf. Scale bars: 20 μm. (H) Histogram of the number of TUNEL-positive cells per retinal section in wild-type and banprw337 mutant retinas injected with STD MO and tp53 MO at 48 hpf and 72 hpf. Two-way ANOVA, Tukey’s multiple comparisons test, Mean ± SD. [n=3 for STD-MO at 48 hpf and tp53-MO at 72 hpf; n=4 for tp53-MO at 48 hpf and STD-MO at 72 hpf, p****<0.0001].
|
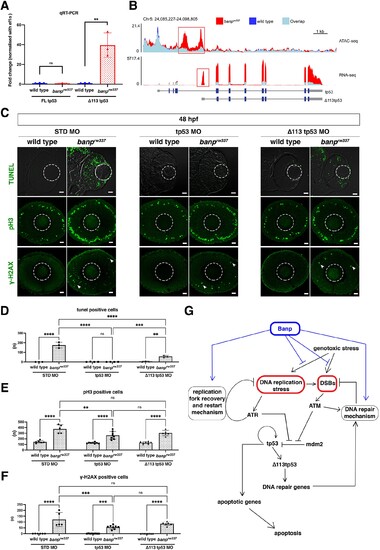
(A) Quantitative RT-PCR-based validation of FL tp53 and ∆113tp53 mRNA expression at 48 hpf. ∆113tp53 mRNA expression is markedly higher in banprw337 mutants than in wild-type siblings, whereas FL tp53 mRNA is not significantly different between mutants and wild-type siblings. Unpaired t-test (two-tailed), Mean ± SD. [n=3, p**<0.01, ns (not significant)]. (B) ATAC-seq- and RNA-seq-based validation of chromatin accessibility (upper panel) and transcription level (bottom panel) of the genomic region covering both tp53 and ∆113tp53 transcription units. Data of wild-type and banprw337 mutants are indicated in blue and red, respectively. Light blue indicates overlapping level. The red openbox in ATAC-seq shows open chromatin in banprw337 mutants in intron 4, signifying differential transcription of ∆113tp53 using an internal promoter. (C) TUNEL (top), anti-pH3 antibody labeling (middle), and anti-γ-H2AX antibody labeling (bottom) of wild-type and banprw337 mutant retinas injected with STD MO, tp53 MO, and ∆113tp53 MO. TUNEL data of 48 hpf wild-type sibling and banprw337 mutant retinas injected with STD MO and tp53 MO are shared with those shown in Figure 3G. tp53 MO-mediated knockdown completely rescues apoptosis in banprw337 mutant retinas at 48 hpf. However, ∆113tp53 MO-mediated knockdown mildly inhibits apoptosis in banprw337 mutant retinas. Neither tp53 MO nor ∆113tp53 MO effectively rescued mitotic cell accumulation and accumulation of γ-H2AX-positive cells (white arrowheads) in banprw337 mutant retinas. Scale bars: 20 μm. (D–F) Histogram of the number of TUNEL-positive cells (D), pH3-positive cells (E), and γ-H2AX-positive cells (F) per retinal section in wild-type and banprw337 mutants injected with STD-MO, tp53 MO, and ∆113tp53 MO. TUNEL data of 48 hpf wild-type sibling and banprw337 mutant retinas injected with STD MO and tp53 MO are shared with those shown in Figure 3H. Two-way ANOVA with Tukey’s multiple comparisons test, Mean ± SD. [n=in graph, p*<0.05, p**<0.01, p***<0.001, p****<0.0001, ns (not significant)]. (G) Possible role of Banp in tp53-mediated DNA damage response pathway. DNA replication stress activates ATR, which subsequently promotes DNA replication fork recovery. Failure of stalled fork recovery causes DSBs, which activate ATM-dependent DNA damage repair. ATR and ATM inhibit Mdm2-mediated tp53 degradation. Stabilized tp53 initially promotes transcription of the ∆113tp53 isoform, which activates cell-cycle arrest genes and promotes DNA damage repair. Chronic activation of tp53 promotes transcription of apoptotic genes to induce apoptosis. Banp may normally suppress DNA replication stress by promoting DNA replication fork recovery or DNA damage repair. Banp may suppress genotoxic stress-mediated activation of DNA replication stress and DSB formation.
|
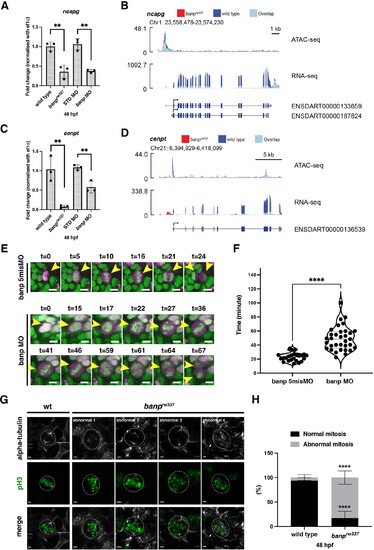
(A) Quantitative RT-PCR of ncapg expression at 48 hpf. ncapg mRNA expression is down-regulated in banprw337 mutants and banp morphants. Unpaired t-test (two-tailed), Mean ± SD. [n=3, p**<0.01]. (B) ATAC-seq and RNA-seq analysis of ncapg mRNA transcription. In banprw337 mutants, chromatin access is reduced at the TSS of ncapg (ATAC-seq) and transcript expression is markedly decreased (RNA seq). (C) Quantitative RT-PCR of cenpt expression at 48 hpf. cenpt mRNA expression is down-regulated in banprw337 mutants and banp morphants. Unpaired t-test (two-tailed), Mean ± SD. [n=3, p**<0.01]. (D) ATAC-seq and RNA-seq analysis of cenpt mRNA transcription. In banprw337 mutants, chromatin access is reduced at the TSS of cenpt (ATAC-seq) and transcript expression is markedly decreased (RNA seq). (E) Time-lapse images of mitosis of retinal progenitor cells injected with banp 5misMO (upper) and banp MO (lower) at 2 dpf using Tg [h2afv: GFP; EF1α: mCherry-zGem] transgenic zebrafish. In retinas injected with banp 5misMO, mitosis proceeds sequentially from prophase (t=5–10 min), metaphase (t=16 min), anaphase (t=21 min), and telophase (t=24 min). On the other hand, in banp morphant retinas, the duration of mitosis from prophase to telophase was 67 min, significantly longer than that of the control MO (24 min). Furthermore, a prophase-like chromosome arrangement appeared abnormally (t=59) after several metaphase-like alignments (t=36 and 46), followed by anaphase (t=64) and telophase. Scale bar: 5 μm. (F) Violin plot of the duration of mitosis from prophase to telophase in retinas injected with banp 5misMO and banp MO. Mitosis in banp morphants is significantly longer than that of banp 5misMO injected embryos. Mann Whitney test, Mean ± SD. [n=3, p****<0.0001] (G) Confocal images of metaphase cells in zebrafish retinas at 48 hpf. The mitotic spindle is labeled with anti-α-tubulin antibody, whereas metaphase chromosomes are labeled with anti-pH3 antibody. The mitotic spindle is correctly attached to metaphase chromosomes in wild-type retinal cells (left panel). On the other hand, mitotic cells in banprw337 mutants exhibit inefficient mitotic spindle attachment and poorly orientated metaphase chromosomes (right panels). Dotted circles indicate the outline of metaphase cells. Scale bar: 2 μm. (H) Percentage of cells with normal and abnormal spindle attachment in wild-type and banprw337 mutant embryos. Two-way ANOVA with Šídák’s multiple comparisons test, Mean ± SD. [n=3, p****<0.0001].
|
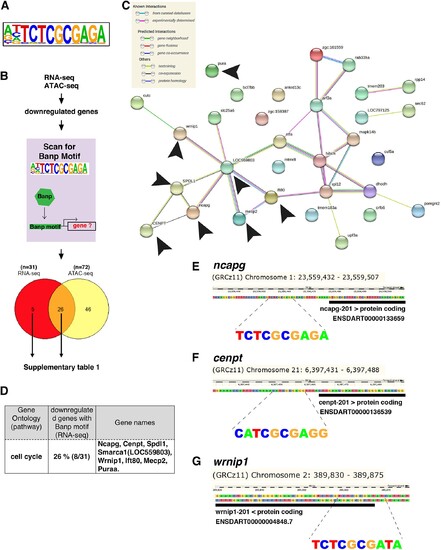
(A) The motif enriched in genomic regions in which chromatin accessibility is reduced in banprw337 mutants. This sequence shows a high similarity to the Banp motif. (B) A schematic diagram representing the flow of RNA-sequencing combined with ATAC-sequencing to find candidates for zebrafish Banp direct-target genes. HOMER was used to scan for Banp motifs in downregulated candidate genes, from RNA- and ATAC-sequencing in banprw337 mutants. RNA sequencing yielded 31 candidates, whereas ATAC-sequencing yielded 72, with 26 target genes consistent in both. These 26 candidate genes are the most likely to be target genes of Banp. (C) STRING interactome analysis showing the interaction of Banp motif-containing genes downregulated in RNA-sequencing. Black arrowheads specify genes related to cell-cycle regulation. (D) Banp target candidate genes related to cell-cycle regulation. Gene ontology (GO) analysis was applied to 31 Banp motif-containing genes downregulated in RNA-sequencing. Twenty-six percent of these genes are engaged in the cell-cycle regulation. Others participate in a variety of non-categorized pathways. (E) Banp motif upstream to the 5’-UTR of ncapg. The black box represents the 5’-UTR. (F) Banp motif upstream to the 5’-UTR of cenpt. The black box represents the 5’-UTR. (G) Banp motif upstream to the 5’-UTR of wrnip1. The black box represents the 5’-UTR.
|
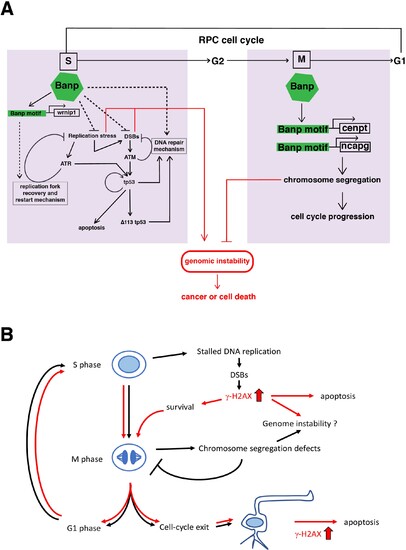
(A) Our study reveals two major roles of Banp in cell-cycle regulation of retinal progenitor cells. In general, DNA replication stress, DSBs, and chromosome segregation defects induce genomic instability, which causes cancer or cell death. In S phase, Banp may suppress DNA replication stress by promoting transcription of the wrnip1, which protects stalled replication forks and promotes replication restart after replication stress. Failure of recovery from DNA replication stress induces DSBs, which activate ATM/Chk2/tp53-mediated DNA damage response. Banp may promote DNA damage repair in concert with tp53. ATR also activates tp53 through activation of Chk1 or crosstalk with ATM. Banp may suppress genotoxic stress-mediated DNA replication stress and DSBs. In M phase, Banp is required for chromosome segregation by promoting transcription of two mitotic regulators, cenpt and ncapg. Since a Banp motif is found near TSSs of the cenpt, ncapg and wrnip1 genes, it is likely that these genes are direct targets of Banp. Dotted arrows indicate proposed regulatory pathway, which will be necessary to investigate in the future. (B) banprw337 mutant phenotypes along the cell-cycle progression and neurogenesis. In banp mutants, stalled DNA replication and subsequent DSBs are accumulated, leading to increase in γ-H2AX+ cells. These DNA damaged cells undergo apoptosis. In M phase, mitosis is markedly prolonged due to chromosome segregation defects; however, almost all mitoses are eventually completed, so it is less likely that M phase defects directly link to apoptosis. It is possible that a fraction of γ-H2AX+ cells survive and enter M phase, so DNA damage is inherited by daughter cells, which reenter the cell-cycle or differentiate into postmitotic neurons. Neuron with a high level of γ-H2AX+ signals may undergo apoptosis. Thus, S phase defects and M phase defects influence each other through cell-cycle progression in banp mutants. Red lines indicate path of γ-H2AX+ cells.
|