
- Title
-
Netrins and netrin receptors are essential for normal targeting of sensory axons in the zebrafish olfactory bulb
- Authors
- Dang, P., Barnes, D.T., Cheng, R.P., Xu, A., Ji Moon, Y., Sripad Kodukula, S., Raper, J.A.
- Source
- Full text @ Neuroscience
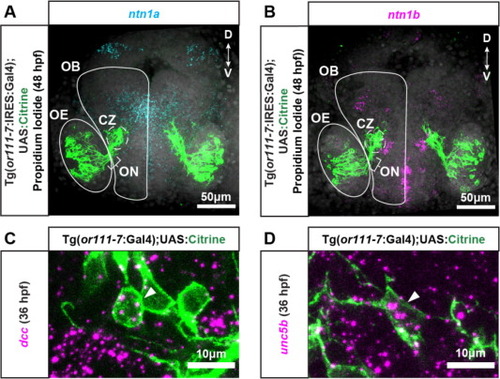
Fig. 1. Ntn1a, ntn1b, dcc, and unc5b expression in the developing olfactory system. A subset of OSNs is labelled by expression of the Tg(or111-7:IRES:Gal4) transgene (green). (A) Frontal view max projection of the olfactory system of a 48 hpf larvae showing representative ntn1a expression (cyan) in the medial OB. The right olfactory epithelium (OE), olfactory bulb (OB), olfactory nerve (ON), and Central Zone protoglomerulus (CZ) are labeled. (B) Frontal view max projection of the olfactory system of a 48 hpf larvae showing representative ntn1b expression (magenta) ventral-medial to the CZ anteriorly, dorsal-lateral to the CZ posteriorly, and in the dorsolateral OB. The right olfactory epithelium (OE), olfactory bulb (OB), olfactory nerve (ON), and Central Zone protoglomerulus (CZ) are labeled. (C) Optical slice of a 36 hpf OE showing expression of dcc in an Tg(or111-7:IRES:Gal4);UAS:Citrine expressing OSN (White arrowhead). D. Optical slice of a 36 hpf OE showing expression of unc5b in an Tg(or111-7:IRES:Gal4);UAS:Citrine expressing OSN (White arrowhead). |
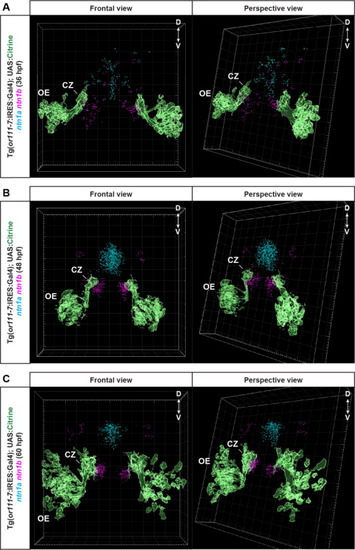
Fig. 2. Ntn1a and ntn1b expression projected onto models of the developing zebrafish olfactory bulb. (A) Model of a 36 hpf zebrafish olfactory system showing consensus ntn1a and ntn1b expression in frontal (left) or perspective (right) views. Ntn1a expression in cyan, ntn1b expression in magenta, and Tg(or111-7:IRES:Gal4);UAS:Citrine expression in green. Gridlines in the frame are spaced at 10 µm. (B) Model of a 48 hpf zebrafish olfactory system showing consensus ntn1a and ntn1b expression from frontal and perspective views. (C) Model of a 60 hpf zebrafish olfactory system showing consensus ntn1a and ntn1b expression from frontal and perspective views. |
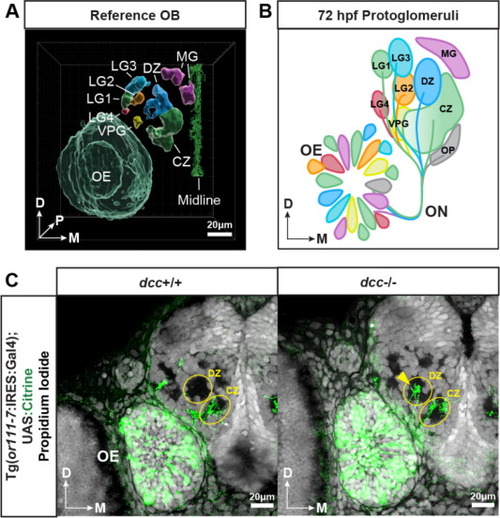
Fig. 3. Protoglomerular identity and targeting. (A) Model of a 72 hpf reference OB hemisphere including the OE (left) and the midline (right). Individual protoglomeruli, the OE, and midline structures were segmented from an unbiased consensus template created from twenty OB hemispheres. (B) Schematic of the 72 hpf zebrafish olfactory system as originally inferred by OMP:RFP and TRPC2:Venus expression. (C) Representative confocal sections of wild type and dcc mutant siblings showing Tg(or111-7:IRES:Gal4);UAS:Citrine expressing OSN axons (green) terminating in individual protoglomeruli. Yellow arrow indicates misprojecting axons into the DZ protoglomerulus. EXPRESSION / LABELING:
PHENOTYPE:
|
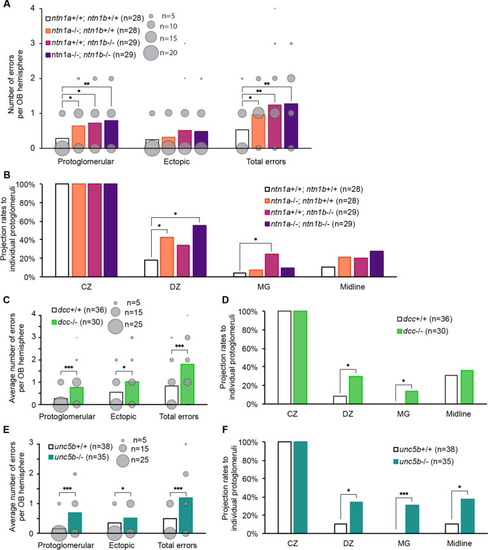
Fig. 4. Ntn1a, ntn1b, dcc, and unc5b are each required for normal protoglomerular targeting of or111-7 transgene-expressing OSNs. (A) The rate of misprojections in ntn1a, ntn1b, or ntn1a/ntn1b double mutants is elevated as compared to wild type embryos. There is no significant increase in errors in double mutants as compared to either single mutant alone. (Bars represent the mean number of misprojections. Circle widths are proportional to the number of samples counted with the indicated number of misprojections.) (B) Significant mistargeting to the DZ protoglomerulus is observed in ntn1a and in ntn1a/ntn1b double mutants, and to the MG protoglomerulus in ntn1b mutants. (C) Significantly increased protoglomerular and ectopic errors are observed in dcc mutants. (Bars represent the mean number of misprojections. Circle widths are proportional to the number of samples counted with the indicated number of misprojections.) (D) Significant protoglomerular mistargeting is directed towards the DZ and MG protoglomeruli in dcc mutants. (E) Significantly increased protoglomerular and ectopic errors are observed in unc5b mutants. (Bars represent the mean number of misprojections. Circle widths are proportional to the number of samples counted with the indicated number of misprojections) (F) Protoglomerular mistargeting is directed towards the DZ and MG protoglomeruli in unc5b mutants. Additional aberrant trajectories towards the midline were observed in unc5b mutants. Student’s T-test was used to assess the significance of overall error rates, while Fisher’s exact test was used to assess the significance of protoglomerular mistargeting (*: 0.05, **: 0.01, ***: 0.001; two tailed). PHENOTYPE:
|
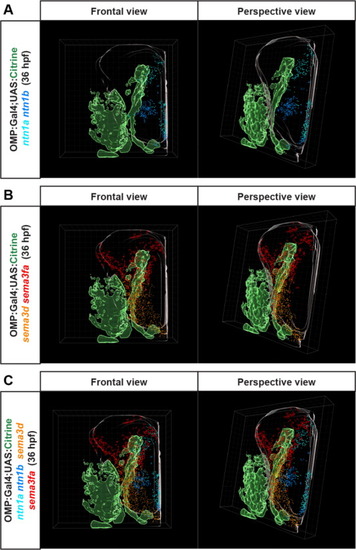
Fig. 5. Visualizing the expression patterns of multiple guidance cues in the 36 hpf zebrafish OB. (A) Frontal and perspective views of ntn1a and ntn1b expression aggregated from four samples each and aligned to a 36 hpf OB model. The OB model includes a representation of OMP:Gal4;UAS:Citrine expressing OSNs in green and an outline of an OB hemisphere in grey. Lateral is to the left, dorsal to the top, and the midline to the right. (B) Frontal and perspective views of sema3d and sema3fa expression aggregated from four samples each and aligned to the 36 hpf OB model. (C) Frontal and perspective views of the 36 hpf zebrafish OB model showing expression patterns of ntn1a, ntn1b, sema3d, and sema3fa all superimposed. EXPRESSION / LABELING:
|