
Fig. 5
|
Fig. 5
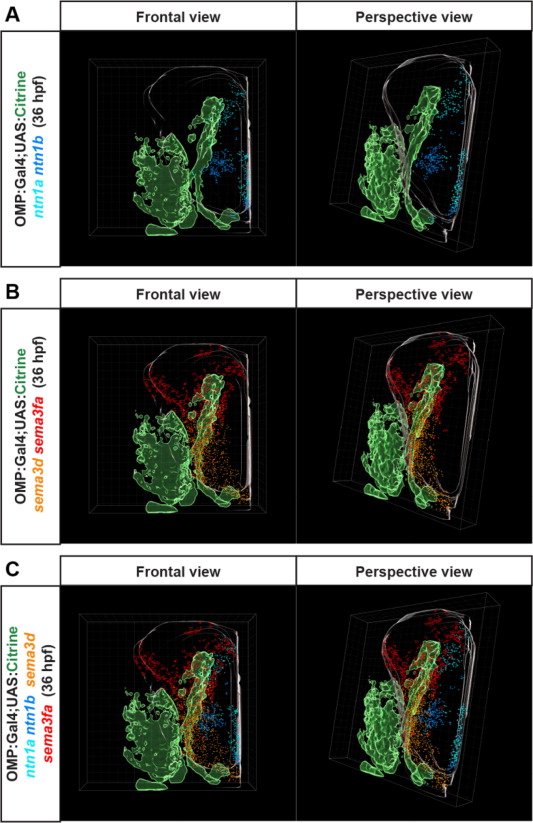
Fig. 5. Visualizing the expression patterns of multiple guidance cues in the 36 hpf zebrafish OB. (A) Frontal and perspective views of ntn1a and ntn1b expression aggregated from four samples each and aligned to a 36 hpf OB model. The OB model includes a representation of OMP:Gal4;UAS:Citrine expressing OSNs in green and an outline of an OB hemisphere in grey. Lateral is to the left, dorsal to the top, and the midline to the right. (B) Frontal and perspective views of sema3d and sema3fa expression aggregated from four samples each and aligned to the 36 hpf OB model. (C) Frontal and perspective views of the 36 hpf zebrafish OB model showing expression patterns of ntn1a, ntn1b, sema3d, and sema3fa all superimposed.