
- Title
-
Systematic Characterization of the Disruption of Intestine during Liver Tumor Progression in the xmrk Oncogene Transgenic Zebrafish Model
- Authors
- Li, Y., Lee, A.Q., Lu, Z., Sun, Y., Lu, J.W., Ren, Z., Zhang, N., Liu, D., Gong, Z.
- Source
- Full text @ Cells
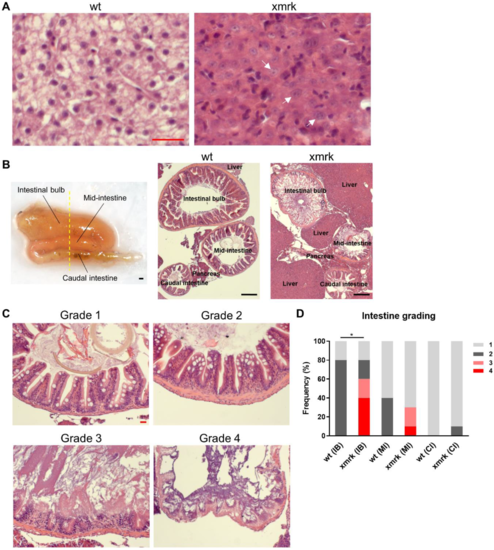
Figure 1. Disruption of intestine morphology after 6 weeks of HCC induction. (A) Representative H&E images showing the normal liver in wild-type (wt) fish and the HCC liver in xmrk fish. It was found that 100% of xmrk livers progressed into HCC after 6 weeks of doxycycline treatment. White arrows indicate example tumor cells with large irregular nuclei and prominent nucleoli. (B) Dissected intestine showing the folding of intestine into three segments (left panel). Intestine samples were sectioned transversely in order to view all three segments of the intestine concurrently on the same section. The yellow dashed line showed the approximate position of section. Representative H&E images taken at 50× magnification showing all three intestine segments and the surrounding liver and pancreas on the same section for wt and xmrk fish, respectively (middle and right panels). (C) Representative H&E images of the intestine taken at 200× magnification. All three segments in each wt and xmrk intestine sample were assigned a grade based on phenotype severity, with grade 1 being the least severe and grade 4 being the most severe. (D) Quantification of intestine grading percentage in wt vs. xmrk. Grade numbers are indicated in the legend according to examples in C. Scale bar in red 20 μm, black 200 μm. IB: Intestinal bulb; MI: Mid-intestine; CI: Caudal intestine. * p < 0.05.
|
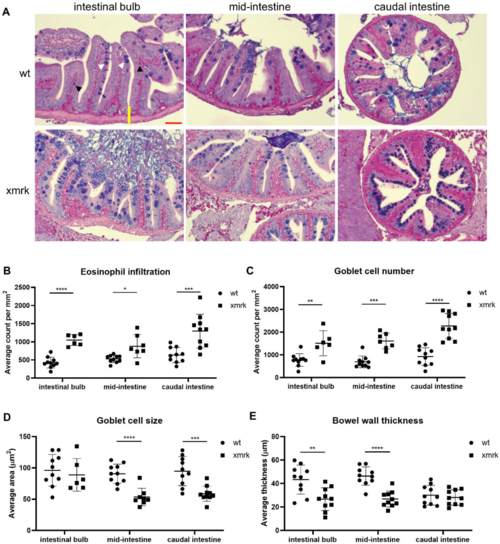
Figure 2. Characterization of intestine phenotype after 6 weeks of HCC induction through Alcian blue-periodic acid-Schiff (AB-PAS) stain. (A) Representative images of AB-PAS staining in all three intestine segments. Scale bar in red 50 μm. (B–E) Quantification of eosinophil counts (B), goblet cell counts (C), goblet cell size (D) and bowel wall thickness (E) in wt vs. xmrk intestine. Bowel wall was measured from the trough between two villi to the outer edge of the intestine (shown as a yellow line in the top left representative image). Black arrowheads indicate fuchsia-colored eosinophils, and white arrowheads indicate bluish-purple goblet cells. * p < 0.05, ** p < 0.01, *** p < 0.001, **** p < 0.0001.
|
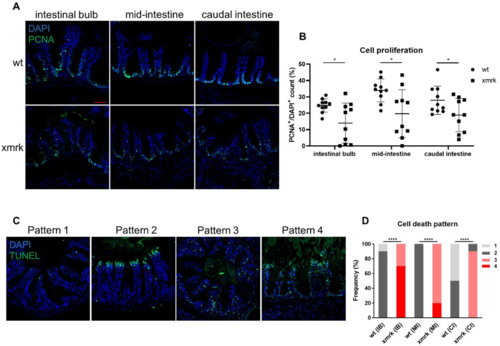
Figure 3. Cell proliferation and cell death in the intestine after 6 weeks of HCC induction. (A) Representative images of immunofluorescent staining for PCNA in the three intestine segments. (B) Quantification of cell proliferation in the intestine. Percentage of PCNA+ cell counts compared to DAPI+ cell counts is presented. (C) Representative images of TUNEL staining, classified into four different patterns. (D) Quantification of cell death pattern in the intestine based on frequency. Scale bar in red 50 μm. IB: intestinal bulb; MI: mid-intestine; CI: caudal intestine. * p < 0.05, **** p < 0.0001.
|
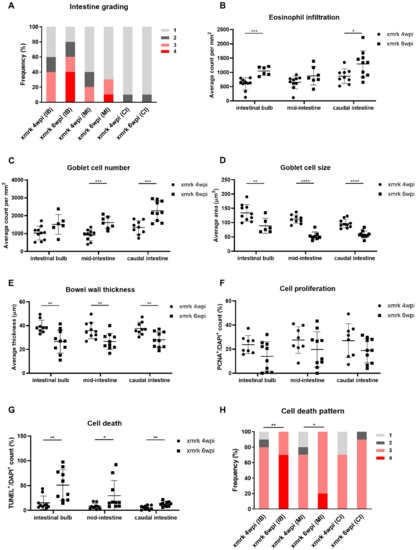
Figure 4. Progressive disruption of intestine structure upon HCC induction. (A–H) Quantification of intestinal severity grading (A), eosinophil counts (B), goblet cell counts (C), goblet cell size (D), bowel wall thickness (E), cell proliferation (F), cell death (G) and cell death pattern (H) in 4-week HCC (xmrk 4 wpi) vs. 6-week HCC (xmrk 6 wpi). wpi: weeks post-oncogene induction; IB: intestinal bulb; MI: mid-intestine; CI: caudal intestine. * p < 0.05, ** p < 0.01, *** p < 0.001, **** p < 0.0001.
|
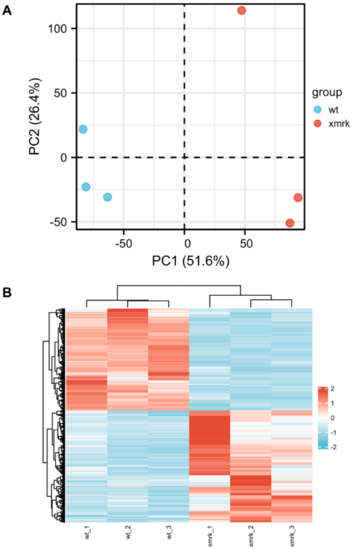
Figure 5. Overview of RNA─seq data. (A) Principal component analysis (PCA) plot of wt and xmrk intestine datasets. (B) Hierarchical clustering of wt and xmrk intestine datasets and heatmap using differentially expressed genes (DEGs) with average TPM > 10. Values were row scaled using z─scores to show relative expression. Blue and red indicated low and high expression, respectively.
|
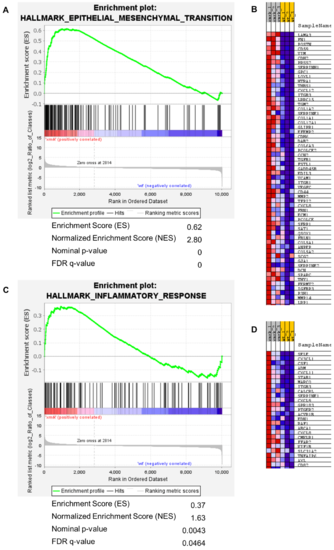
Figure 6. Gene set enrichment analysis of hallmark gene sets epithelial mesenchymal transition and inflammatory response. (A) GSEA summary plot of epithelial mesenchymal transition gene set comparing xmrk intestine to wt intestine. The gene set was highly enriched and upregulated: normalized enrichment score (NES) = 2.80, FDR q─value < 0.0001. (B) Heatmap of leading edge subset genes within the epithelial mesenchymal transition gene set (red: high expression; blue: low expression). (C) GSEA summary plot of inflammatory response gene set comparing xmrk intestine to wt intestine. The gene set was enriched and upregulated: NES = 1.63, FDR q─value = 0.0464. (D) Heatmap of leading edge subset genes within the inflammatory response gene set (red: high expression; blue: low expression).
|
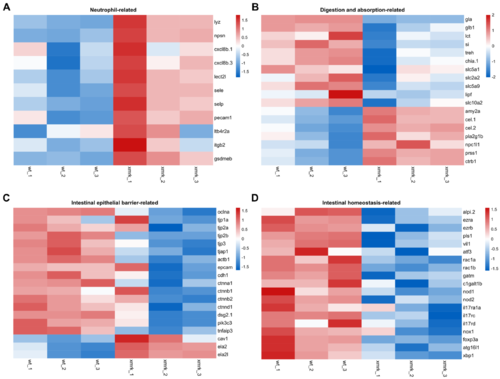
Figure 7. Differential expression profiles of genes related to neutrophils and intestine function. (A–D) Heatmap showing expression profile of neutrophil─related genes (A), digestion─ and absorption─related genes (B), intestinal epithelial barrier─related genes (C) and intestinal homeostasis─related genes (D). Heatmaps were generated with log─transformed TPM values, which were row scaled using z─scores, using the Heatmap module (v0.2.4) on the Hiplot platform (https://hiplot.com.cn, accessed on 4 April 2022).
|