
FIGURE
Fig. 2
- ID
- ZDB-FIG-220615-22
- Publication
- Li et al., 2022 - Systematic Characterization of the Disruption of Intestine during Liver Tumor Progression in the xmrk Oncogene Transgenic Zebrafish Model
- Other Figures
- All Figure Page
- Back to All Figure Page
Fig. 2
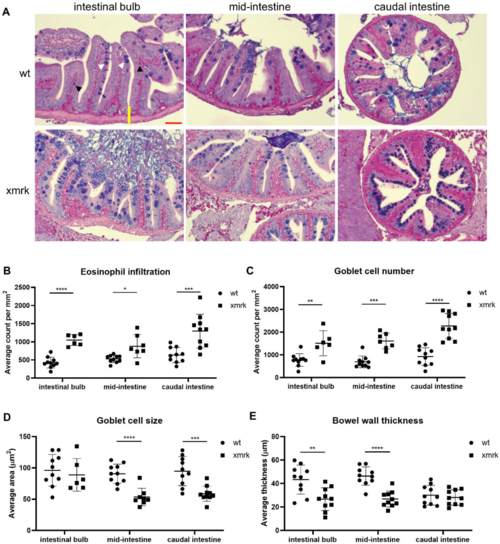
Figure 2. Characterization of intestine phenotype after 6 weeks of HCC induction through Alcian blue-periodic acid-Schiff (AB-PAS) stain. (A) Representative images of AB-PAS staining in all three intestine segments. Scale bar in red 50 μm. (B–E) Quantification of eosinophil counts (B), goblet cell counts (C), goblet cell size (D) and bowel wall thickness (E) in wt vs. xmrk intestine. Bowel wall was measured from the trough between two villi to the outer edge of the intestine (shown as a yellow line in the top left representative image). Black arrowheads indicate fuchsia-colored eosinophils, and white arrowheads indicate bluish-purple goblet cells. * p < 0.05, ** p < 0.01, *** p < 0.001, **** p < 0.0001.
|
Expression Data
Expression Detail
Antibody Labeling
Phenotype Data
Phenotype Detail
Acknowledgments
This image is the copyrighted work of the attributed author or publisher, and
ZFIN has permission only to display this image to its users.
Additional permissions should be obtained from the applicable author or publisher of the image.
Full text @ Cells