
FIGURE
Fig. 3
- ID
- ZDB-FIG-220615-23
- Publication
- Li et al., 2022 - Systematic Characterization of the Disruption of Intestine during Liver Tumor Progression in the xmrk Oncogene Transgenic Zebrafish Model
- Other Figures
- All Figure Page
- Back to All Figure Page
Fig. 3
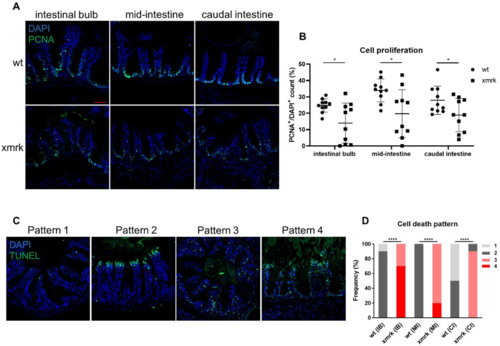
Figure 3. Cell proliferation and cell death in the intestine after 6 weeks of HCC induction. (A) Representative images of immunofluorescent staining for PCNA in the three intestine segments. (B) Quantification of cell proliferation in the intestine. Percentage of PCNA+ cell counts compared to DAPI+ cell counts is presented. (C) Representative images of TUNEL staining, classified into four different patterns. (D) Quantification of cell death pattern in the intestine based on frequency. Scale bar in red 50 μm. IB: intestinal bulb; MI: mid-intestine; CI: caudal intestine. * p < 0.05, **** p < 0.0001.
|
Expression Data
Expression Detail
Antibody Labeling
Phenotype Data
Phenotype Detail
Acknowledgments
This image is the copyrighted work of the attributed author or publisher, and
ZFIN has permission only to display this image to its users.
Additional permissions should be obtained from the applicable author or publisher of the image.
Full text @ Cells