
Image
|
Figure Caption
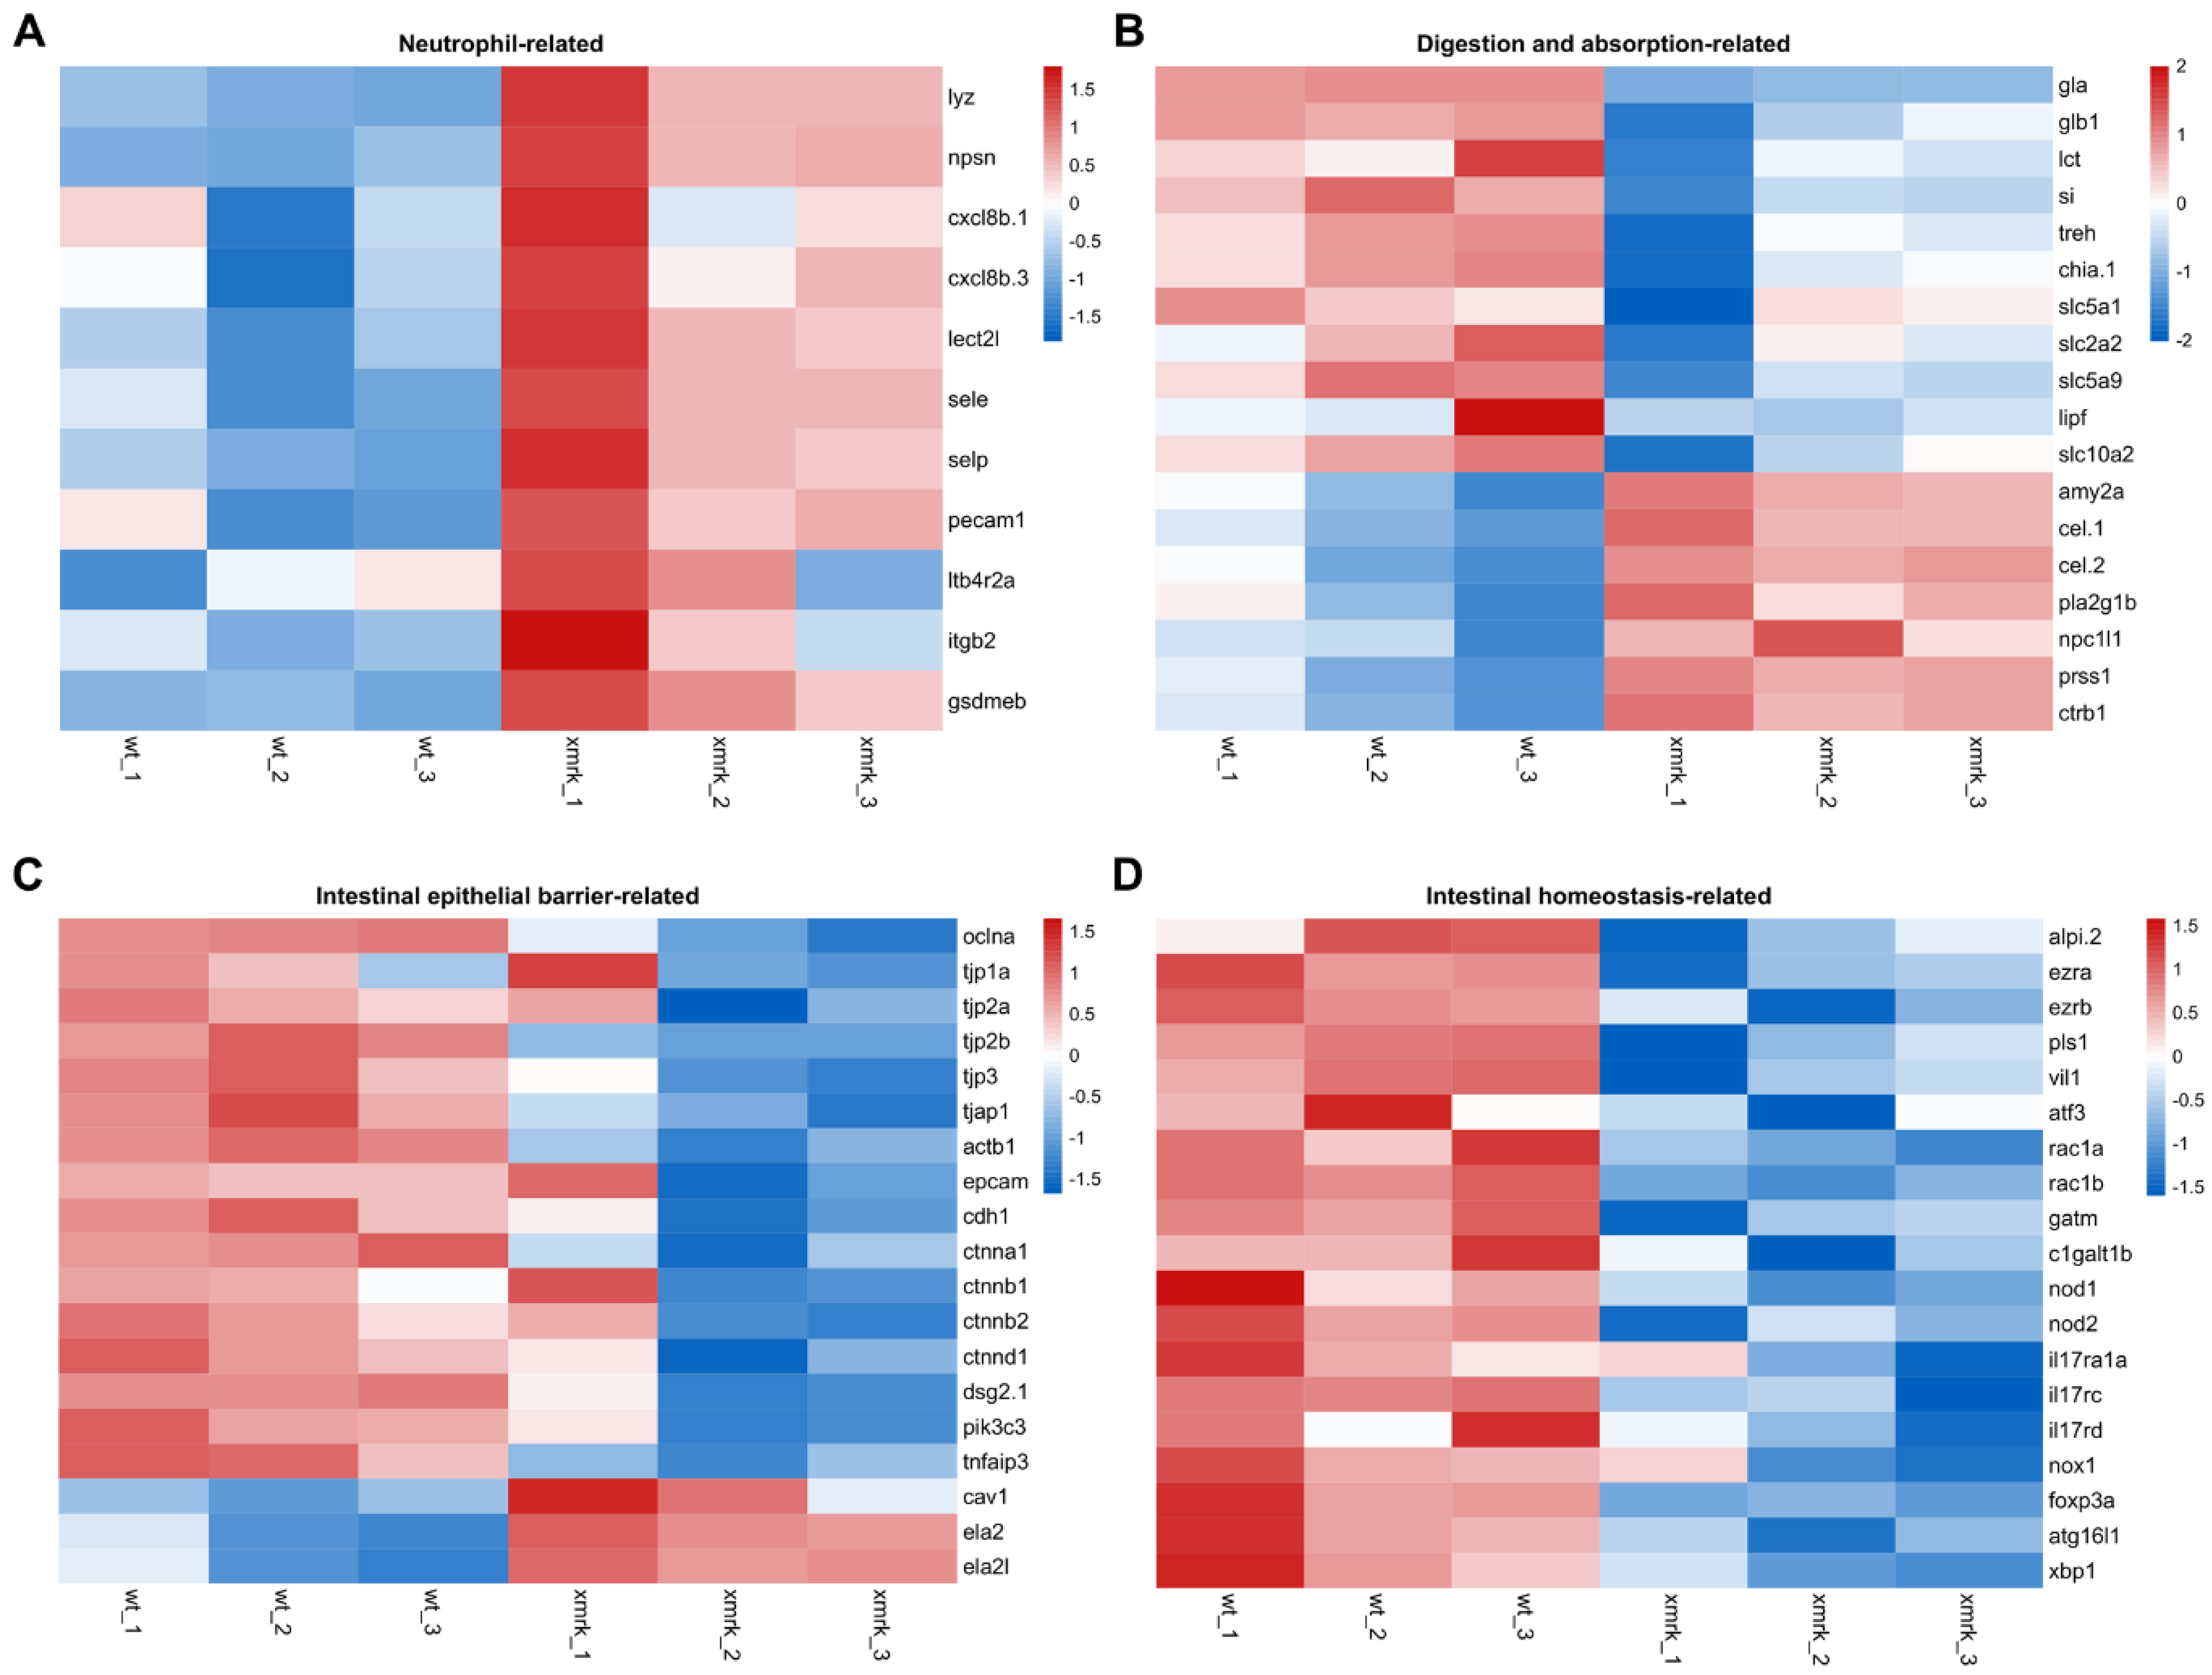
Fig. 7
Figure 7. Differential expression profiles of genes related to neutrophils and intestine function. (A–D) Heatmap showing expression profile of neutrophil─related genes (A), digestion─ and absorption─related genes (B), intestinal epithelial barrier─related genes (C) and intestinal homeostasis─related genes (D). Heatmaps were generated with log─transformed TPM values, which were row scaled using z─scores, using the Heatmap module (v0.2.4) on the Hiplot platform (https://hiplot.com.cn, accessed on 4 April 2022).
Acknowledgments
This image is the copyrighted work of the attributed author or publisher, and
ZFIN has permission only to display this image to its users.
Additional permissions should be obtained from the applicable author or publisher of the image.
Full text @ Cells