
- Title
-
Endocardial identity is established during early somitogenesis by Bmp signalling acting upstream of npas4l and etv2
- Authors
- Capon, S.J., Uribe, V., Dominado, N., Ehrlich, O., Smith, K.A.
- Source
- Full text @ Development
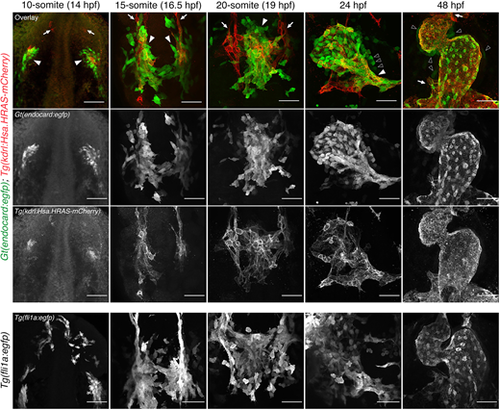
Time-course analysis of Gt(endocard:egfp) fluorescence demonstrates enriched endocardial expression at somitogenesis stages in the zebrafish embryo. Immunofluorescence staining of Gt(endocard:egfp); Tg(kdrl:Hsa.HRAS-mCherry) and Tg(fli1a:egfp) embryos from 10 s through to 48 hpf. Anterior to the top. Anterior views at 48 hpf, all other images show dorsal views. White arrowheads label kdrl+/endocard:egfp+ endocardial cells. White arrows label kdrl+/endocard:egfp− vascular endothelial cells. Black arrowheads label presumptive myocardial cells. Scale bars: 50 μm. EXPRESSION / LABELING:
|
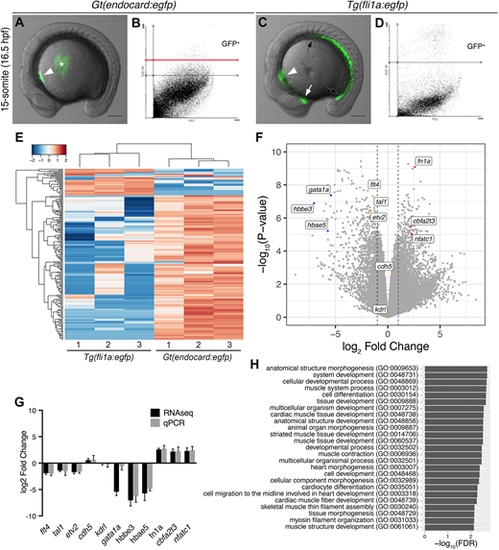
The endocardium is molecularly distinct from the vascular endothelium. (A,C) Live images of Gt(endocard:egfp) and Tg(fli1a:egfp) embryos at the 15 somite-stage (16.5 hpf) showing GFP fluorescence. GFP fluorescence can be seen in the endocardial progenitors (white arrowhead) of Gt(endocard:egfp) embryos (A), some auto-fluorescence is seen in the yolk (asterisk). In Tg(fli1a:egfp) embryos (C), GFP fluorescence can be seen in the entire vascular endothelium of the trunk (black arrows) and head (white arrow) as well as the endocardium (white arrowhead). Scale bars: 50 μm. (B,D) FACS plots from dissociated Gt(endocard:egfp) (B) and Tg(fli1a:egfp) (D) embryos show the gating strategy to collect GFP+ cells: two gates were used to collect high and low GFP+ populations for Gt(endocard:egfp) embryos, and all analysis was performed on cells collected above the red line (B), whereas a single population was collected for Tg(fli1a:egfp) embryos (D). (E) Hierarchical clustering of the top 200 most variable genes across all samples shows that samples segregate according to transgene. (F) Volcano plot showing the spread of differentially expressed genes with a subset of genes labelled, the dotted lines show a log2 fold change of 1 or −1. (G) Validation of the subset of genes highlighted in F by qPCR (G). Log2 fold change is represented, error bars indicate 95% confidence intervals. (H) GO term analysis using a PANTHER overrepresentation test was performed on TREAT lists of genes upregulated in the Gt(endocard:egfp)High samples relative to Tg(fli1a:egfp). The 25 most significant GO terms for genes enriched in the endocardium are shown. EXPRESSION / LABELING:
PHENOTYPE:
|
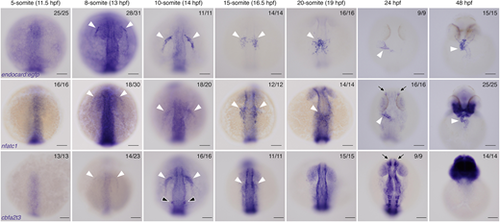
Endocardial markers are first expressed at 8 s in zebrafish embryos.In situ hybridisation for endocard:egfp, nfatc1 and cbfa2t3 expression in embryos from 5 s (11.5 hpf) through to 48 hpf, showing expression emerging in the endocardium from 8 s onwards. White arrowheads show the expression domains corresponding to endocardial cells and their progenitors. nfatc1 expression is also observed in the olfactory placode (black arrows) as previously described. cbfa2t3 expression is also seen in otic vesicle progenitors (black arrowheads) and throughout the neural system (black arrows). Anterior to the top in all images. Anterior views at 48 hpf, all other images show dorsal views. Scale bars: 100 μm. The number of embryos matching the image shown is indicated in the top right of each image. EXPRESSION / LABELING:
|
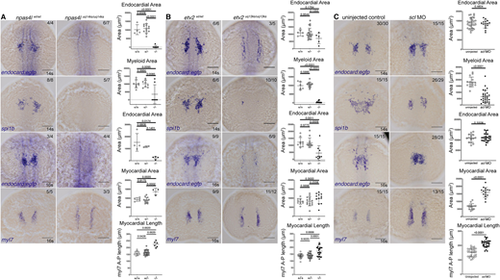
Gt(endocard:egfp) expression is reduced in npas4l and etv2 mutants. (A-C) In situ hybridisation for endocard:egfp and spi1b expression at 14 s and endocard:egfp and myl7 expression at the 16 s in npas4luq14ks mutants (A), etv2uq13ks mutants (B) and scl morphants (C). Quantification of the expression domain was measured by calculating the surface area of the stain or the length of the staining domain. These measurements are shown in adjacent graphs, where wild-type (+/+), heterozygous (+/−) and mutant (−/−) quantification is depicted for npas4luq14ks and etv2uq13ks mutants and siblings, and uninjected or morphant treatment for scl. Dorsal views, with anterior to the top. Scale bars: 100 μm. Data are mean±s.d. P-values are present in graphs were calculated using a one-way ANOVA (for npas4l and etv2 mutant analysis) or an unpaired two-tailed t-test (for scl MO analysis). EXPRESSION / LABELING:
PHENOTYPE:
|
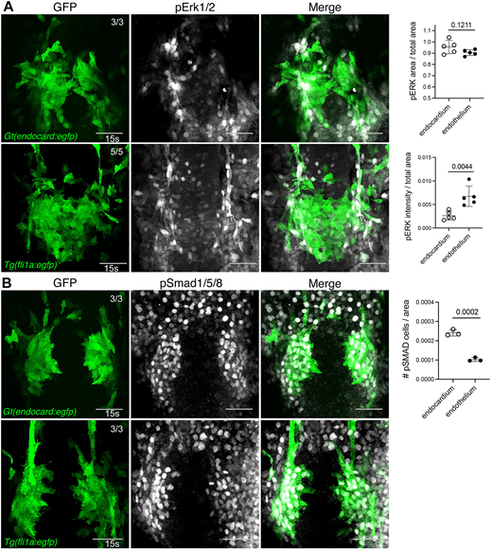
Bmp signalling is active in developing endocardial cells. (A,B) Immunofluorescence staining for pErk1/2 (A) in Gt(endocard:egfp) and Tg(fli1a:egfp) embryos at 15 s shows minimal pErk1/2 signal in endocardial cells and high activity in the adjacent vascular endothelium. By contrast, pSmad1/5/8 (B) in Gt(endocard:egfp) and Tg(fli1a:egfp) embryos at 15 s shows high pSmad1/5/8 activity in developing endocardial cells but minimal activity in adjacent vasculature. Quantification of pErk1/2 area and intensity or pSMAD cell number in endocardium or adjacent vasculature is depicted in neighbouring graphs. Dorsal views are shown with anterior to the top in all images. Scale bars: 50 μm. Data are mean±s.d. P-values are present in graphs (determined by an unpaired two-tailed t-test). EXPRESSION / LABELING:
PHENOTYPE:
|
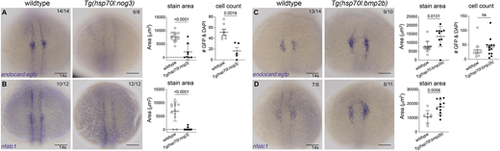
Bmp signalling is required for endocardial development. (A,B) In situ hybridisation for endocardial markers endocard:egfp (A) and nfatc1 (B) in wild-type (transgenic negative siblings) or Tg(hsp70l:nog3) embryos at the 14 somite (s) stage [heat-shock performed at tailbud stage (10 hpf)] shows significantly reduced staining of the endocardial domain upon inhibition of Bmp signalling. Quantification of the staining area of expression is shown in adjacent graphs. Quantification of GFP-positive and DAPI-positive cell number is also shown, as determined by confocal imaging of Gt(endocard:egfp), DAPI-stained embryos at 14-15 s. (C,D) Wild-type sibling controls or Tg(hsp70l:bmp2b) embryos at 14 s (heat-shocked at tailbud) show increased staining area in embryos stained for endocard:egfp (C) or nfatc1 (D). Quantification of the area of expression shown in adjacent graphs. Dorsal views are shown with anterior to the top in all images. Scale bars: 100 μm. Data are mean±s.e.m. P-values are present in graphs (unpaired two-tailed t-test). ns, not significant. EXPRESSION / LABELING:
PHENOTYPE:
|

Epistasis experiments show that npas4l and etv2 are downstream of Bmp signalling. (A) In situ hybridisation for endocard:egfp expression in wild type and etv2 mutant with and without the hsp70l:bmp2b transgene. etv2 mutants have reduced endocard:egfp expression, irrespective of Bmp overexpression. (B) Quantification of the staining area shows Bmp overexpression increased the endocard:egfp expression domain whereas endocard:egfp expression is lost in etv2 mutants, regardless of Bmp overexpression. (C-F) Reciprocal experiments involving in situ hybridisation for endocard:egfp expression in wild-type (transgenic negative siblings) or Tg(hsp70l:nog3) embryos injected with 30 pg of etv2 (C) or 10 pg of npas4l (E) mRNA. Quantification of staining area shows that both etv2 (D) and npas4l (F) mRNA overexpression can restore endocard:egfp expression upon Bmp inhibition. Scale bars: 100 μm. Data are mean±s.d. P-values are indicated in graphs. **P<0.01 (one-way ANOVA). ns, not significant. EXPRESSION / LABELING:
PHENOTYPE:
|