
- Title
-
Blood vessel occlusion by Cryptococcus neoformans is a mechanism for haemorrhagic dissemination of infection
- Authors
- Gibson, J.F., Bojarczuk, A., Evans, R.J., Kamuyango, A.A., Hotham, R., Lagendijk, A.K., Hogan, B.M., Ingham, P.W., Renshaw, S.A., Johnston, S.A.
- Source
- Full text @ PLoS Pathog.
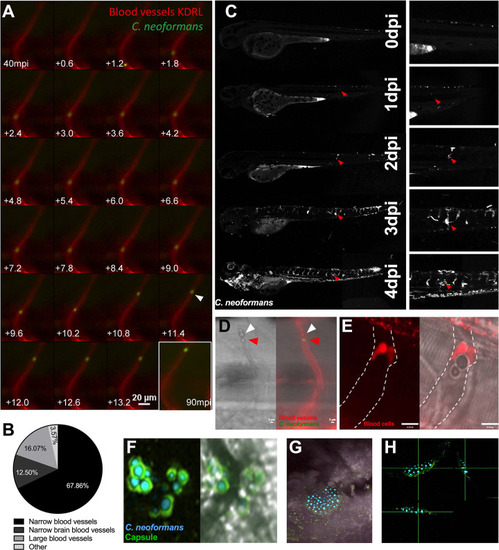
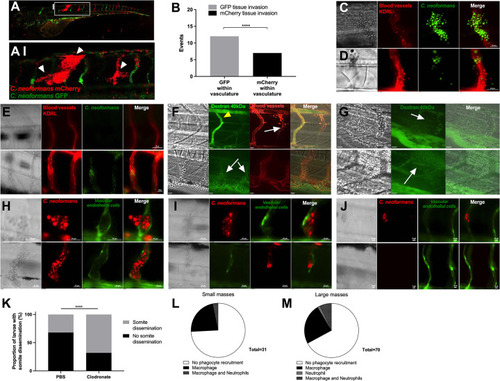
A Infection of KDRL mCherry blood marker transgenic line with 25 cfu GFP |
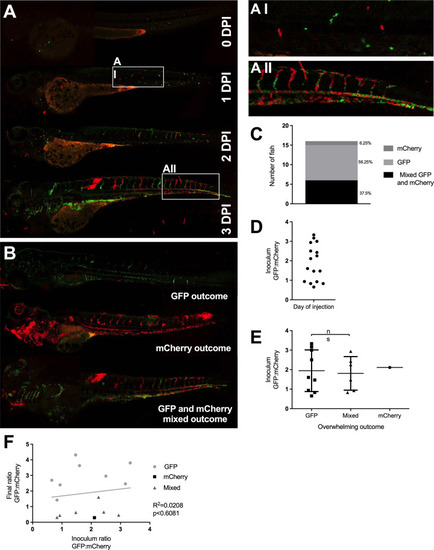
Infection of 2 dpf AB larvae with 25 cfu of a 5:1 ratio of GFP:mCherry KN99 |
Infection of 2 dpf AB larvae with 25 cfu of a 5:1 ratio of GFP:mCherry KN99 |
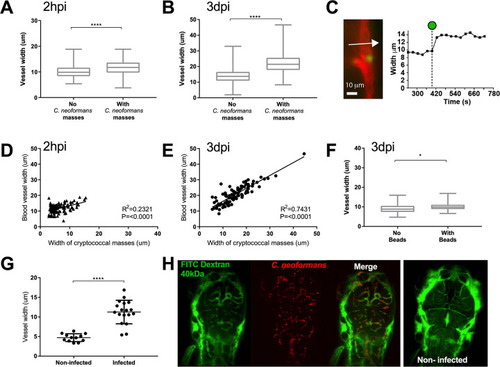
A-E: Infection of KDRL mCherry blood marker transgenic line with 1000 cfu GFP |
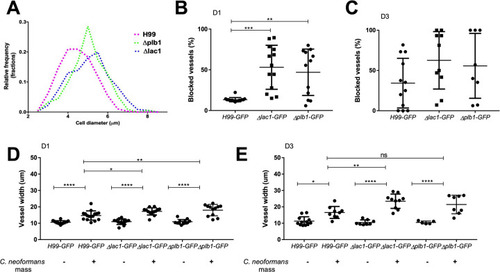
A-E: Infection of KDRL mCherry blood marker transgenic line with 1000 cfu |
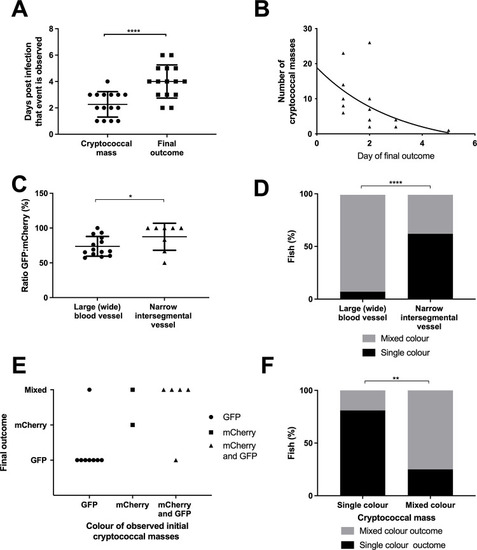
A-B Infection of 2 dpf AB larvae with 25 cfu of a 5:1 ratio of GFP:mCherry KN99 |
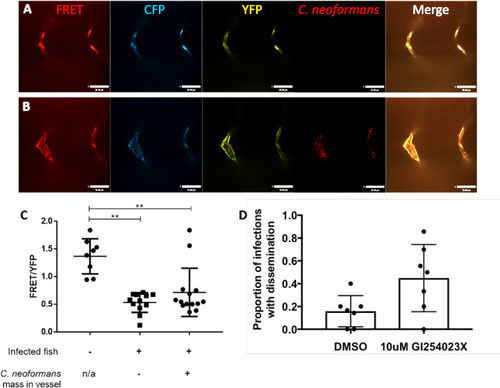
A-C Infection of FRET tension reporter (VE-cadherin-TS) transgenic zebrafish line with 1000 cfu mCherry |