IMAGE

Fig 4

ID
ZDB-IMAGE-220426-32
Source
Figures for Gibson et al., 2022
Image
Figure Caption

Fig 4 Localised clonal expansion proportionally increases vasculature size.

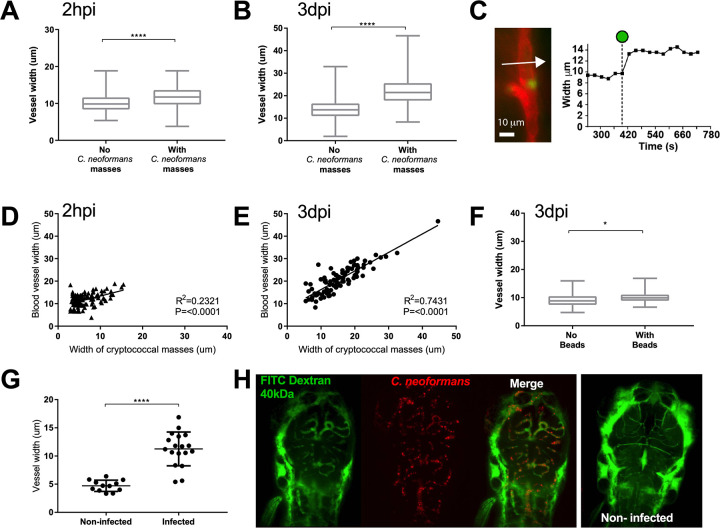
A-E: Infection of KDRL mCherry blood marker transgenic line with 1000 cfu GFP C. neoformans or inert beads A Inter-segmental vessel width with and without cryptococcal masses at 2 hpi (n = 3, +/- SEM, ****p<0.0001, unpaired t-test) B Inter-segmental vessel with and without cryptococcal masses at 3 dpi (n = 3, +/- SEM, ****p<0.0001, unpaired t-test) C Left panel—Image from a time-lapse movie of KDRL mCherry zebrafish larvae showing a blood vessel (red) in the zebrafish brain and a C. neoformans cell (green). Right panel—graph showing the change in diameter of the blood vessel measured at the point indicated by the white arrow in Ci, at each frame in the time-lapse. The dotted line on the x axis indicates the timepoint where the Cryptococcus cell becomes stuck at the point of measurement (white arrow). D Relationship between C. neoformans mass and vessel width at 2 hpi (n = 3, linear regression) E Relationship between C. neoformans mass and vessel width at 3 dpi (n = 3, linear regression) F Vessel width with and without beads present at 3 dpi (n = 3, +/- SEM, *p<0.05, unpaired t-test). G-H: Inoculation of mCherry C. neoformans with 40kDa FITC Dextran to mark blood vessels G Comparison of infected brain vessels width to non-infected corresponding brain vessels (three infected fish analysed, +/- SEM, ****p<0.0001, paired t-test) H Example image of infected and non-infected brain vessels.

Figure Data
Acknowledgments
This image is the copyrighted work of the attributed author or publisher, and ZFIN has permission only to display this image to its users. Additional permissions should be obtained from the applicable author or publisher of the image. Full text @ PLoS Pathog.