FIGURE SUMMARY
Title

Functional Differentiation of BMP7 Genes in Zebrafish: bmp7a for Dorsal-Ventral Pattern and bmp7b for Melanin Synthesis and Eye Development

Authors
Dong, X.R., Wan, S.M., Zhou, J.J., Nie, C.H., Chen, Y.L., Diao, J.H., Gao, Z.X.
Source
Full text @ Front Cell Dev Biol

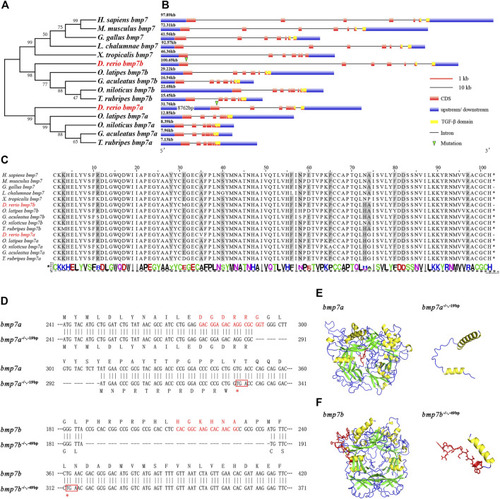
Phylogenetic analysis, conservative sequence, and protein structure prediction of BMP7 genes. (A) Phylogenetic analysis of BMP7 genes among different species. (B) The structural analysis of BMP7 genes among different species. The green triangle represents the knockout site of bmp7a and bmp7b. (C) Conservation analysis of amino acids in BMP7 genes’ domains among different species. (D) Schematic representation of bmp7a and bmp7b DNA and protein sequences, and the mutant alleles for bmp7a and bmp7b. CRISPR-Cas9 target sequence is marked with red letters in the wild and mutant DNA sequences. The missing nucleotides are represented by (-) in the mutant, and the red box represents the stop codon. (E) The bmp7a protein tertiary structure prediction of wild type and mutation with -19 bp deletion. The yellow area represents the α-helix; the green area represents the β-sheet; the red area represents the missing part of the mutation. (F) The bmp7b protein tertiary structure prediction of wild type and mutation with -49 bp deletion. The yellow area represents the α-helix; the green area represents the β-sheet; the red area represents the missing part of the mutation.

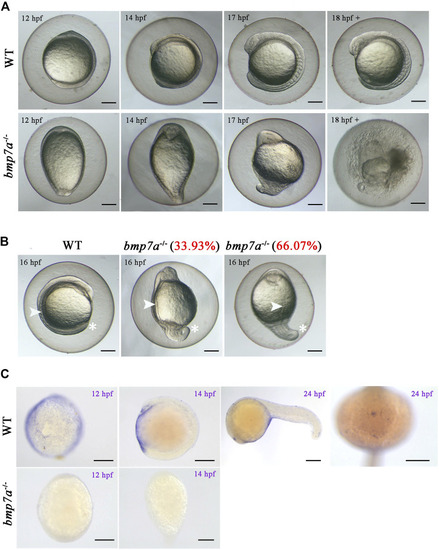
Observation of the homozygous lethal phenotype and gene expression in bmp7a embryos. (A) Morphological features of the wild-type and bmp7a-/- embryos at 12 hpf, 14 hpf, 17 hpf and after 18 hpf. (B) Morphological features of the wild-type and bmp7a-/- embryos at 16 hpf. The proportion of mutant embryos with different morphology in mutant embryos at 16 hpf was shown in red font. (C) Whole-mount in situ hybridization of the bmp7a gene at 12 hpf, 16 hpf wild-type and bmp7a-/- embryos, and whole-mount in situ hybridization of the bmp7a at 24 hpf wild-type embryos. Scale bars, 200 μm.

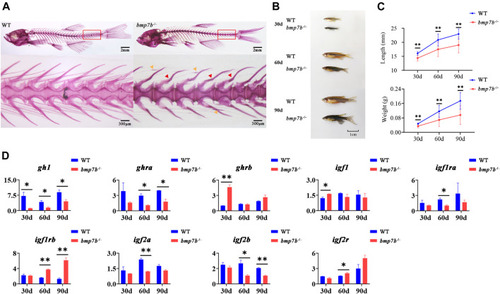
The bone and growth phenotype, and gene expression differences between the wild-type and bmp7b-/- zebrafish. (A) Alizarin red staining for mineralized bones at 3 months old fish. The red arrow indicates the severely curved part of the haemal arches, and the yellow arrow indicates the nodular part of the intermuscular bone. (B) The external physical characteristics. (C) The differences of body length and weight. (D) Quantitative expression analysis of growth related genes. Statistically significant differences are marked as *p < 0.05 and **p < 0.01.

The skin structure, melanin content and gene expression differences between the wild-type and bmp7b-/- zebrafish. (A) Schematic diagram. Top: The part of skin melanin tissue section. The red arrow represents the position on the fish body where the tissue section was observed and analyzed. Bottom: the cross-sectional schematic diagram, 1, 2, 3, and 4 correspond to the observation position of the tissue section picture in turn. (B) Skin tissue section. The arrow points to the melanin area. (C) Determination of the melanin content of the skin. The absorbance/wet weight (A290/g) represents the melanin content. (D) The volcano map of DEGs. The abscissa represents multiple changes in gene expression in wild-type and bmp7b-/- fish. The ordinate represents the statistical significance of differences in gene expression. (E) KEGG enrichment analysis of skin transcriptome. (F) Heat map of differential genes enriched in skin transcriptome KEGG. (G) qPCR of key genes (wnt7ba, gna14, erbb3b, bambia and bmp7b). Statistically significant differences are marked as *p < 0.05 and **p < 0.01.

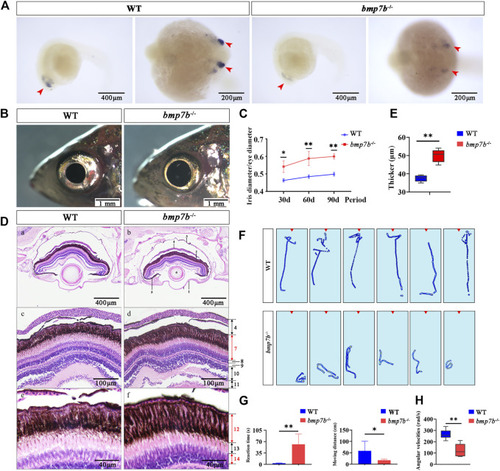
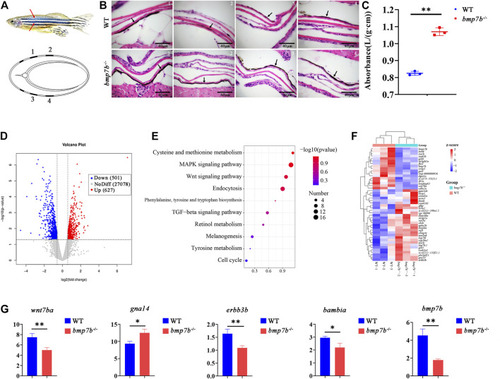
The eye structure, feeding behavior and gene expression differences between the wild-type and bmp7b-/- zebrafish. (A) Whole-mount in situ hybridization of the bmp7b at 24 hpf. The blue area represents the zebrafish eyes. (B) The external physical characteristics of eyes. (C) Comparative analysis of the proportion of iris diameter in eye diameter in different points (30, 60, and 90 dpf). (D) HE staining results of eye tissue sections. 1, cornea; 2, retina; 3, sclera; 4, choroid; 5, iris; 6, lens; 7, pigment cell epithelium and photosensitive layer; 8, outer granular layer; 9, outer reticulum layer; 10, inner granule Layer; 11, inner reticulum layer; 12, pigment cell layer; 13, rod cell layer; 14, cone cell layer. (E) Thickness measurement of melanin layer in different regions of eye tissue slices (n = 6). (F) Heat map showing trajectories of adults within 5 s after stimulation (adding brine shrimp) (six repetitions). The red triangle area represents the location of adding brine shrimp. (G) Reaction time and movement distance of adult zebrafish within 5 s after adding brine shrimp. (H) Angular velocities of juvenile zebrafish within 5 s after the light intensity was reduced (from light to dark). Statistically significant differences are marked as *p < 0.05 and **p < 0.01.

EXPRESSION / LABELING:
Gene:
Fish:
Anatomical Term:
Stage: Prim-5
PHENOTYPE:
Fish:
Observed In:
Stage Range: Prim-5 to Adult

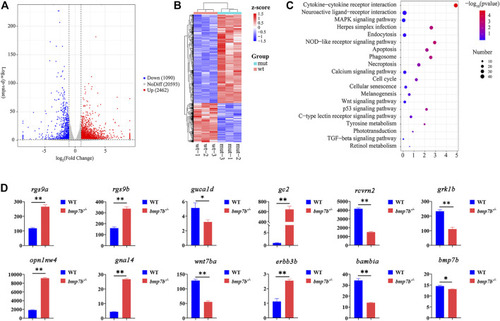
The transcriptome and gene qRT-PCR analysis of eye tissues between the wild-type and bmp7b-/- zebrafish at 30 days. (A) DEG’s volcano map. (B) DEG’s Heat map. (C) KEGG enrichment analysis of the eye transcriptome. (D) QPCR of key genes (rgs9a, rgs9b, rcvrn2, guca1d, grk1b, opn1mw4, gc2, and bmp7b). Statistically significant differences from the wildtypes and bmp7b-/- mutants are marked as *p < 0.05 and **p < 0.01.

EXPRESSION / LABELING:
Genes:
Fish:
Anatomical Term:
Stage: Days 30-44
PHENOTYPE:
Fish:
Observed In:
Stage: Days 30-44

ZFIN is incorporating published figure images and captions as part of an ongoing project. Figures from some publications have not yet been curated, or are not available for display because of copyright restrictions.

PHENOTYPE:
Fish:
Observed In:
Stage Range: 5-9 somites to Prim-5
Acknowledgments
This image is the copyrighted work of the attributed author or publisher, and ZFIN has permission only to display this image to its users. Additional permissions should be obtained from the applicable author or publisher of the image. Full text @ Front Cell Dev Biol