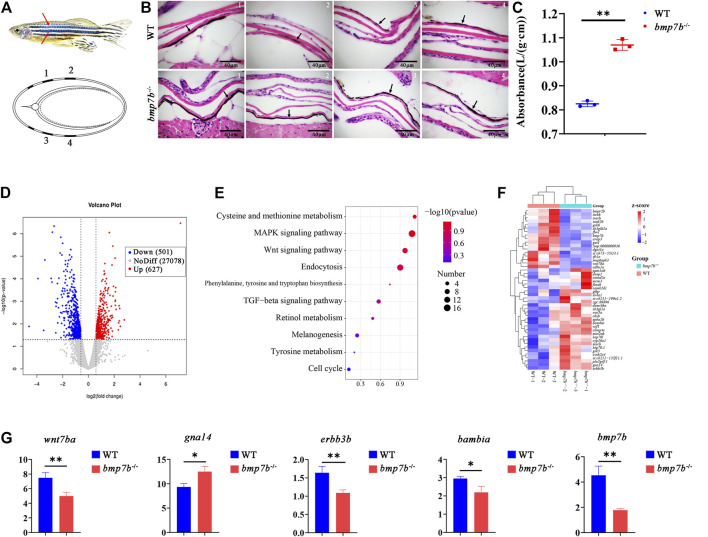
IMAGE

FIGURE 4

ID
ZDB-IMAGE-220406-25
Genes
Source
Figures for Dong et al., 2022
Image
Figure Caption

FIGURE 4

The skin structure, melanin content and gene expression differences between the wild-type and bmp7b-/- zebrafish. (A) Schematic diagram. Top: The part of skin melanin tissue section. The red arrow represents the position on the fish body where the tissue section was observed and analyzed. Bottom: the cross-sectional schematic diagram, 1, 2, 3, and 4 correspond to the observation position of the tissue section picture in turn. (B) Skin tissue section. The arrow points to the melanin area. (C) Determination of the melanin content of the skin. The absorbance/wet weight (A290/g) represents the melanin content. (D) The volcano map of DEGs. The abscissa represents multiple changes in gene expression in wild-type and bmp7b-/- fish. The ordinate represents the statistical significance of differences in gene expression. (E) KEGG enrichment analysis of skin transcriptome. (F) Heat map of differential genes enriched in skin transcriptome KEGG. (G) qPCR of key genes (wnt7ba, gna14, erbb3b, bambia and bmp7b). Statistically significant differences are marked as *p < 0.05 and **p < 0.01.

Figure Data
Acknowledgments
This image is the copyrighted work of the attributed author or publisher, and ZFIN has permission only to display this image to its users. Additional permissions should be obtained from the applicable author or publisher of the image. Full text @ Front Cell Dev Biol