
- Title
-
Uncovering Regulators of Heterochromatin Mediated Silencing Using a Zebrafish Transgenic Reporter
- Authors
- Calvird, A.E., Broniec, M.N., Duval, K.L., Higgs, A.N., Arora, V., Ha, L.N., Schouten, E.B., Crippen, A.R., McGrail, M., Laue, K., Goll, M.G.
- Source
- Full text @ Front Cell Dev Biol

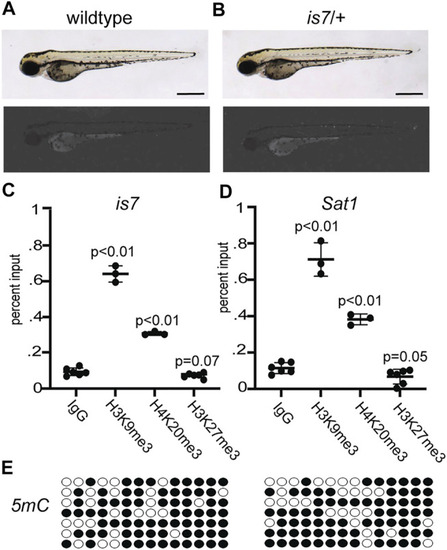
ZFIN is incorporating published figure images and captions as part of an ongoing project. Figures from some publications have not yet been curated, or are not available for display because of copyright restrictions. PHENOTYPE:
|
|
ZFIN is incorporating published figure images and captions as part of an ongoing project. Figures from some publications have not yet been curated, or are not available for display because of copyright restrictions. |
The EXPRESSION / LABELING:
PHENOTYPE:
|
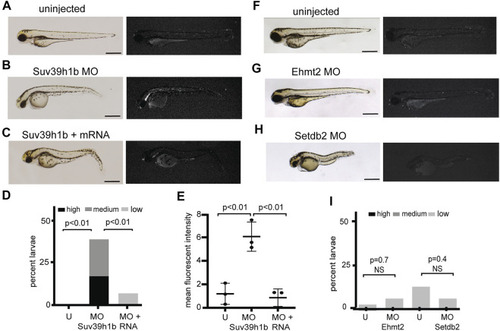
FIGURE 2. Morpholino depletion of the histone H3K9me3 methyltransferase Suv39h1b reactivates expression from the silenced is7 transgene array. (A–C) Representative brightfield (left) and fluorescence (right) images of is7/+ transgenic larvae at 3 dpf. (A) Uninjected control, (B) larva that had been injected with 4 ng Suv39h1b morpholino at the one-cell stage, (C) larva that had been coinjected with Suv39h1b morpholino and 400 pg Suv39h1 mRNA (MO = morpholino). (D) Percent Suv39h1b morpholino injected larvae, Suv39h1b morpholino plus Suv39h1b mRNA injected larvae, and sibling uninjected control larvae that show high, medium or low dsRed fluorescence at 3 dpf (U = uninjected). Roughly 50% of larva from crosses between is7/+ males and wild-type females will be transgenic, therefore a maximum of ∼50% of larvae have the capacity for increased is7 expression. n = 40–50 larvae per experimental condition (E) Mean fluorescent intensity of the three larvae showing the highest dsRed fluorescence in Suv39h1b morpholino injected larval pools, morpholino plus RNA injected larval pools and uninjected sibling control pools at 3 dpf. (F–H) Brightfield (left) and fluorescence (right) images of representative is7/+ transgenic larvae that were uninjected (F), injected with 4 ng of morpholino targeting Ehmt2 (G) or 4 ng of morpholino targeting Setdb2 (H) at the one-cell stage and imaged at 3 dpf. (I) Percent larvae showing high, medium or low dsRed fluorescence after injection with 4 ng Ehmt2 or Setdb2 morpholino compared to sibling uninjected controls. n = 50–60 larvae per experimental condition. All scale bars indicate 1 mm. Error bars indicate standard deviation. EXPRESSION / LABELING:
PHENOTYPE:
|
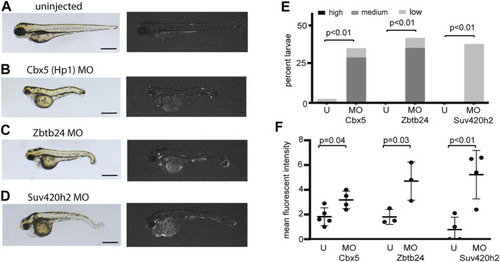
Morpholinos designed to deplete additional proteins involved in heterochromatic repression reactivate expression from the EXPRESSION / LABELING:
PHENOTYPE:
|
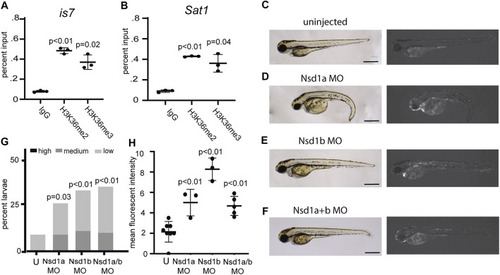
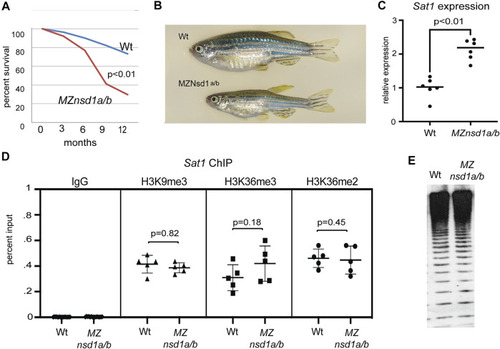
Morpholinos designed to deplete the H3K36 methyltransferases Nsd1a and Nsd1b increase expression from the EXPRESSION / LABELING:
PHENOTYPE:
|
Combined homozygous deletion of |