IMAGE

FIGURE 4

ID
ZDB-IMAGE-220402-18
Genes
Source
Figures for Calvird et al., 2022
Image
Figure Caption

FIGURE 4

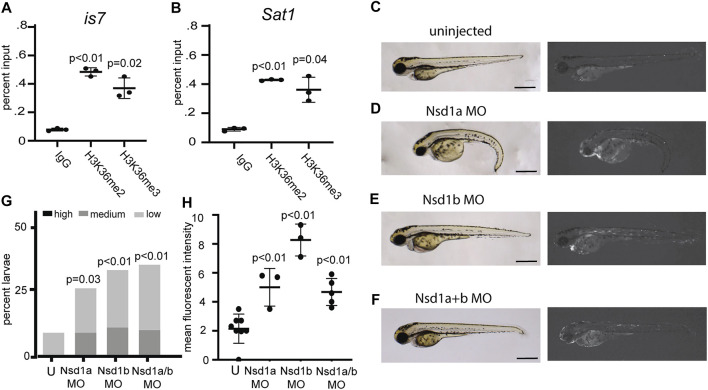
Morpholinos designed to deplete the H3K36 methyltransferases Nsd1a and Nsd1b increase expression from the is7 transgene array. (A–B) Levels of the histone modifications H3K36me2 and H3K36me3 at the is7 transgene array (A) and Sat1 pericentromeric repeats (B) as assessed by ChIP-qPCR (C–F) Brightfield (left) and fluorescence (right) images of representative is7/+ transgenic larvae at 3 dpf. (C) Uninjected control, (D) larva injected with 4 ng of Nsd1a morpholino at the one-cell stage, (E) larva injected with 4 ng of Nsd1b morpholino at the one-cell stage, (F) larva injected with 3 ng each of Nsd1a and Nsd1b morpholino at the once cell stage (MO = morpholino). (G) Percent larvae that show high, medium or low dsRed fluorescence at 3 dpf compared to sibling uninjected controls (U = uninjected) n = 50-70 embryos per condition. (H) Mean fluorescent intensity of larvae showing the highest dsRed fluorescence in morpholino injected larval pools, compared to uninjected sibling control pools at 3 dpf. All scale bars indicate 1 mm. Error bars indicate standard deviation.

Figure Data
Acknowledgments
This image is the copyrighted work of the attributed author or publisher, and ZFIN has permission only to display this image to its users. Additional permissions should be obtained from the applicable author or publisher of the image. Full text @ Front Cell Dev Biol