IMAGE

FIGURE 3

ID
ZDB-IMAGE-220402-17
Genes
Source
Figures for Calvird et al., 2022
Image
Figure Caption

FIGURE 3

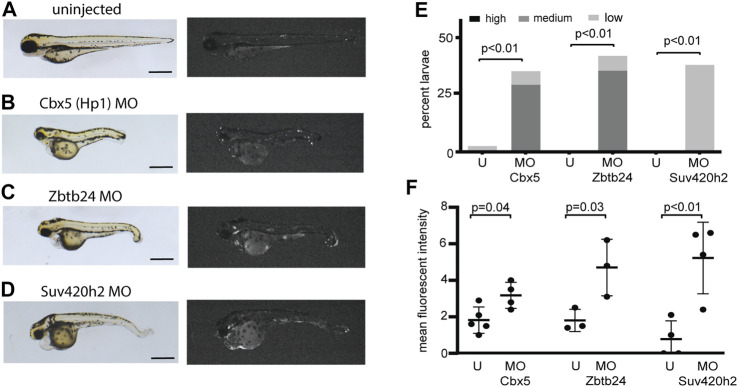
Morpholinos designed to deplete additional proteins involved in heterochromatic repression reactivate expression from the is7 transgene array. (A–D) Representative brightfield (left) and fluorescence (right) images of is7/+ transgenic larvae at 3 dpf. (A) Uninjected control, (B) larva injected with 4 ng of Cbx5 morpholino at the one-cell stage, (C) larva injected with 4 ng of Zbtb24 morpholino at the one-cell stage, (D) larva injected with 4 ng of Suv420h2 morpholino at the one-cell stage. (MO = morpholino). (E) Percent larvae injected with each morpholino that show high, medium or low dsRed fluorescence at 3 dpf compared to sibling uninjected controls (U = uninjected). n = ∼30 embryos per condition (F) Mean fluorescent intensity of larvae showing the highest dsRed fluorescence in morpholino injected larval pools, compared to uninjected sibling control pools at 3 dpf. All scale bars indicate 1 mm. Error bars indicate standard deviation.

Figure Data
Acknowledgments
This image is the copyrighted work of the attributed author or publisher, and ZFIN has permission only to display this image to its users. Additional permissions should be obtained from the applicable author or publisher of the image. Full text @ Front Cell Dev Biol