
- Title
-
Loss of circadian rhythmicity in bdnf knockout zebrafish larvae
- Authors
- D'Agostino, Y., Frigato, E., Noviello, T.M.R., Toni, M., Frabetti, F., Cigliano, L., Ceccarelli, M., Sordino, P., Cerulo, L., Bertolucci, C., D'Aniello, S.
- Source
- Full text @ iScience

Generation of bdnf−/− zebrafish line (A) The bdnf gene structure in Danio rerio is composed of two exons (blue box) and one intron (blue line), with the mRNA coding sequence (CDS) (yellow box) fully present in the exon 2. gRNA designed to target the CDS binds a genomic region immediately after the start codon (red arrow) and determines a 40 bp deletion. (B) Genomic screening by PCR shows a single band of 230 bp in bdnf+/+ fish, one band of 230 bp and one of 190 bp in the bdnf+/-, and a single 190 bp band in the bdnf−/−. (C and D) Western Blot analysis and (D) Bdnf quantification show that Bdnf protein is reduced by approximately 50% in bdnf+/- and almost completely in bdnf−/− in respect to bdnf+/+. Tubulin antibody was used as loading control. Densitometric analysis of Bdnf protein from three biological replicates is normalized with respect to Tubulin. Mean values ±SEM; Dunn’s Multiple Comparison Test: ∗∗p < 0.01. |
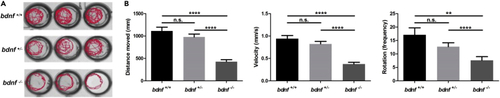
Behavior of bdnf+/- and bdnf−/− zebrafish larvae (A) Reduced swimming activity of bdnf−/− mutant larvae as shown by locomotory tracking with DanioVision. (B) bdnf−/− larvae (n = 96 per strain) assayed for distance, velocity, and rotations at four dpf showed significantly lower scores. Mean values ±SEM; Dunn’s multiple comparison test: n. s. = not significant; ∗∗p < 0.01, ∗∗∗∗p < 0.0001. PHENOTYPE:
|
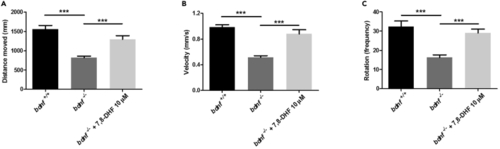
Behavioral tests for pharmacological rescue of bdnf−/− zebrafish larvae (A–C). Normal swimming behavior was rescued by pharmacologic treatments. Distance (A), velocity (B), and rotation (C) was measured for bdnf+/+ larvae, bdnf−/− larvae, bdnf−/− + 7,8-DHF (10 μM). Mean ± SEM; Kruskal-Wallis ANOVA, Distance moved: K3 = 48.26, p < 0.0001; Velocity: K3 = 77.44, p < 0.0001; Rotation: K3 = 33.05, p < 0.0001; Dunn’s Multiple Comparison test: ∗∗∗p < 0.0001. PHENOTYPE:
|
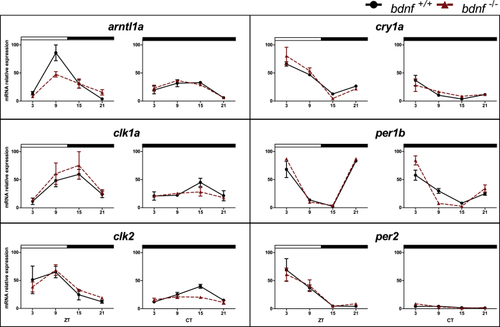
Daily and circadian expression levels of clock genes in zebrafish larvae qPCR analysis of clock and light-regulated clock gene expression at eight dpf in zebrafish larvae exposed to LD cycles and DD. For all panels, each point represents the mean ± SEM (n = 5). Relative expression levels (100% is the maximum level detected for each gene in LD and DD condition) are plotted on the y axis, whereas on the x axes, time is expressed as zeitgeber time (ZT, where ZT0 represents lights on; CT, where CT0 represents beginning of the subjective day). White and black bars represent light and dark periods, respectively. Solid lines indicate bdnf+/+; dotted lines indicate bdnf−/−. |

Daily and circadian expression levels of clock-controlled genes in zebrafish larvae qPCR analysis of clock-controlled gene expression in larvae of zebrafish exposed to LD cycles or DD. For all panels, each point represents the mean ± SEM (n = 5). bdnf+/+ = solid line; bdnf−/− = dotted line. For more details, see Figure 4. |
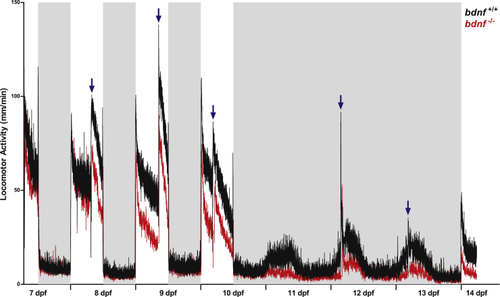
Daily and circadian activity rhythms of bdnf+/+ and bdnf−/− zebrafish larvae Mean waveform of locomotor activity under 12:12 LD cycles from 7 to 10 dpf and DD from 10 to 13 dpf (n = 32/genotype). Vertical axis shows the average distance moved (mm/1 min), whereas X axis indicates time in recording. White and gray bars show light and dark phases, respectively. Blue arrows indicate feeding time. Data are expressed as mean ± SEM. PHENOTYPE:
|
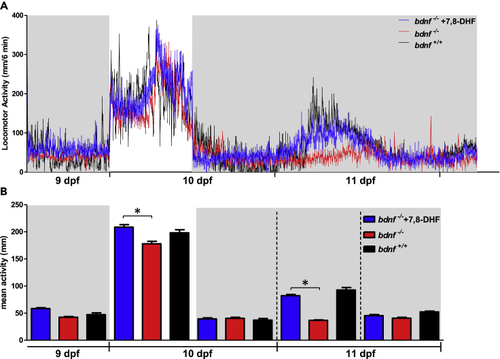
Daily and circadian activity rhythms of pharmacological rescued bdnf−/− zebrafish larvae (A) Mean waveform of locomotor activity under 12:12 LD cycles from 9 to 10 dpf and DD from 10 to 11 dpf (n = 32/group). See Figure 6 for details. (B) Mean activity in the light and dark phases and in subjective day and subjective night in DD from 9 to 11 dpf. Kruskal-Wallis test; ∗p < 0.0001. Data are expressed as mean ± SEM. PHENOTYPE:
|
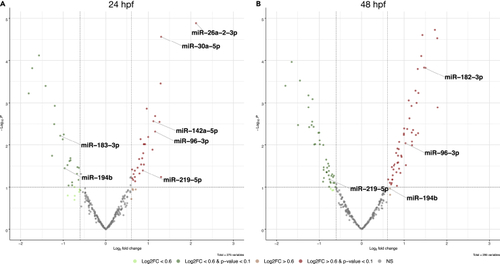
Volcano plots showing differentially expressed miRNAs (A and B) Analysis of the differentially expressed miRNAs at two embryonic stages, 24 hpf (A) and 48 hpf (B), displays changes in the expression level of several miRNAs known to have a role in the regulation of circadian genes. |