FIGURE SUMMARY
Title

Identification of an evolutionarily conserved domain in Neurod1 favouring enteroendocrine versus goblet cell fate

Authors
Reuter, A.S., Stern, D., Bernard, A., Goossens, C., Lavergne, A., Flasse, L., Von Berg, V., Manfroid, I., Peers, B., Voz, M.L.
Source
Full text @ PLoS Genet.

Rescue of <italic toggle='yes'>ascl1a-/-</italic> by ARP/Ascl factors.

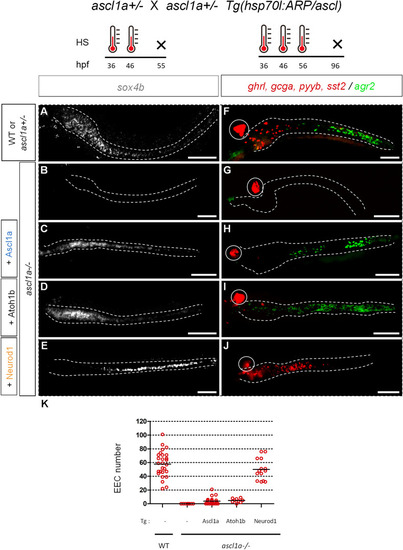
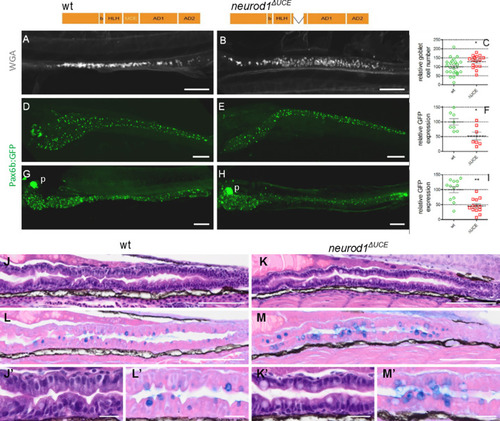
Upper part: scheme of the crossings and timing of the heat shocks (HS). Lower part: A-E: FISH performed at 55 hpf with a sox4b probe on ascl1a-/- or control sibling embryos heat-shocked at 36 and 46 hpf F-J: FISH performed at 96 hpf with the agr2 probe revealed in green and a mix of hormone probes (ghrelin (ghrl), peptide YYb (pyyb), glucagon-a (gcga) and somatostatin-2 (sst2)) revealed in red on ascl1a-/- or control sibling embryos heat-shocked at 36, 46 and 56 hpf. The transgenic line used is indicated on the left part of the figure as well as the genotype of the larvae; the ascl1a-/- larvae were identified by the loss of the pituitary prl expression (not shown). The pancreas is encircled while the location of gut, visualised with a DAPI staining (not shown), is delimited by dashed lines. K: Quantification of the number of ghrl+/pyyb+/gcga+/sst2+ EEC detected in conditions F to J counted under a fluorescent microscope. All views are ventral with the anterior part to the left and represent confocal projection images. Scale bar: 100 μm.

Summary of the rescuing and inducing capacities of Ascl1a, Neurod1 and the chimeric Ascl1a/Neurod1 proteins.

Left part: Schematic representation of the different transgenes used in this study. Column 1: As indicated by a √ sign, Tg1 to Tg8 are all able to rescue sox4b at 55 hpf in the ascl1a-/- larvae, heat-shocked at 36 and 46 hpf (data from Fig 1). Column 2: Comparison of EEC rescuing capacities of Tg1 to Tg8, compared to Tg2 (Neurod1), arbitrarily set to 100%. ascl1a-/- larvae were heat-shocked at 36, 46 and 56 hpf and the number of EECs determined at 96 hpf by FISH. Data from Figs 3 and 5. Column 3: Percentage of ascl1a-/- larvae showing a rescue of goblet cells at 96 hpf upon the expression of Tg1 to Tg8, induced by 3 heat-shocks at 36, 46 and 56 hpf. Data from Figs 3 and 5Column 4: Comparison of capacities of Tg1 to Tg8 to induce pax6b+ cells in wt larvae compared to Tg2 (Neurod1), arbitrarily set to 100%. Larvae were heat-shocked at 48 and 58 hpf and the number of pax6b+ cells determined at 56 hpf by FISH. Data from S4 Fig. N.D.: not done.

Analysis of rescuing capacities of chimeric Neurod1/ Ascl1a proteins in <italic toggle='yes'>ascl1a-/-</italic> larvae.

A-G: FISH performed at 96 hpf with the agr2 probe revealed in green and a mix of hormones probes (ghrl, pyyb, gcga and sst2) revealed in red on ascl1a -/- larvae without (A) or with Tg1 to Tg5 transgenes (B to F) and on sibling control embryos (G). All the larvae have been heat-shocked at 36, 46 and 56 hpf. The transgenic line used is indicated on the left part of the figure as well as the genotype of the larvae; the ascl1a-/- larvae were identified by the loss of the pituitary prl expression (not shown). All views are ventral with the anterior part to the left and represent confocal projection images. The pancreas is encircled while the location of the gut, visualised with a DAPI staining (not shown), is delimited by dashed lines. Scale bar: 100μm. H: Quantification of the number of ghrl+/pyyb+/gcga+/sst2+ EEC detected in conditions A to G counted under a fluorescent microscope.

Neurod1 contains a domain evolutionarily conserved in all vertebrate Neurod family members.

Upper part: Schematic representation of dr-Neurod1 showing the 12aa basic domain (b), the 45aa helix-loop-helix (HLH) domain, the 41aa evolutionary conserved domain (ECD) and the two transactivation domains (AD1 and AD2). Lower part: Alignment of vertebrate Neurod proteins highlighting the ECD and the 19aa ultra conserved elements (UCE). The potential phosphorylation site for the Serine/threonine protein kinases ATM/ATR/DNA-PK (S172 in dr-Neurod1) is indicated by an asterisk. The presence of a conserved S or T at aa176 in dr-Neurod1, highly suggestive of a site of phosphorylation for an unidentified serine/threonine protein kinase, is also indicated by an asterisk.

The ECD domain of Neurod1 represses goblet cell fate.

A-D: FISH performed at 96hpf with a mix of hormones probes (adcyap1a, gcga, insulin-like5a (insl5a) and pyyb) revealed in red and with the agr2 probe revealed in green (A’-D’) on ascl1a-/- transgenic embryos heat-shocked at 36, 46 and 56hpf. The transgenic line used is indicated on the left part of the figure. All views are ventral with the anterior part to the left and represent confocal projection images. The pancreas is encircled while the location of the gut, visualised with a DAPI staining (not shown), is delimited by dashed lines Scale bar: 100 μm. E: Number of EEC rescued cells in the gut when inducing the different transgenes (Tg2, Tg6 to Tg8) in ascl1a-/- larvae F: Percentage of larvae showing no, partial or full rescue of goblet cells when inducing the different transgenes (Tg2, Tg6 to Tg8) in ascl1a-/- larvae. The larvae expressing agr2 at a level similar to wt or higher were classified as “Full rescue” while larvae with lower expression of agr2 compared to wt were classified as “partial rescue”. Larvae without agr2 expression were classified as “no rescue”.

Comparison of the differentially expressed genes.

A: Venn diagram showing the differentially expressed genes for Neurod1 (Tg2) and for ascl1a (Tg1) compared to Ctrl and for Ascl1a vs Neurod1 (FDR ≤ 0,1). B: Plot showing the log2 Fold Change after overexpression of Ascl1a (Tg1) (x-axis) and Neurod1 (Tg2) (y-axis) compared to Ctrl embryos for the 209 DE genes. Genes in blue represent significant Ascl1a DE, in orange, Neurod1 DE and genes in black correspond to genes significantly DE in both conditions. Genes in green represent the 98 additional DE genes identified through the direct comparison of Neurod1- versus Ascl1a-induced samples. C: Expression level of selected DE genes. The expression level (given in normalized CPM) was obtained from the RNA-seq data from Ctrl or hsp70l transgenic lines for Ascl1a (Tg1), Neurod1 (Tg2), Neurod1ΔUCE (Tg7) and Neurod1ΔECD (Tg8) embryos, all heat-shocked at 38 and 48 hpf and harvested at 52 hpf. The values are the expression mean of at least triplicate samples. Panel 1: Expression level for the 10 “endocrine pancreas development” genes. Panel 2: Expression level of selected genes differentially regulated by Neurod1 compared to Ascl1a. Panel 3. Expression level of selected genes differentially regulated by Neurod1ΔUCE and Neurod1ΔECD compared to Neurod1.

Intestinal <italic toggle='yes'>gfi1aa</italic> expression is highly induced by Neurod1<sup>ΔUCE</sup> and Neurod1<sup xmlns:xlink='http://www.w3.org/1999/xlink'>ΔECD</sup>.

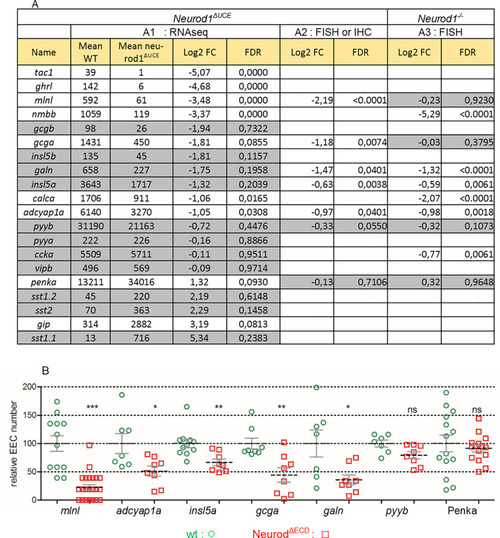
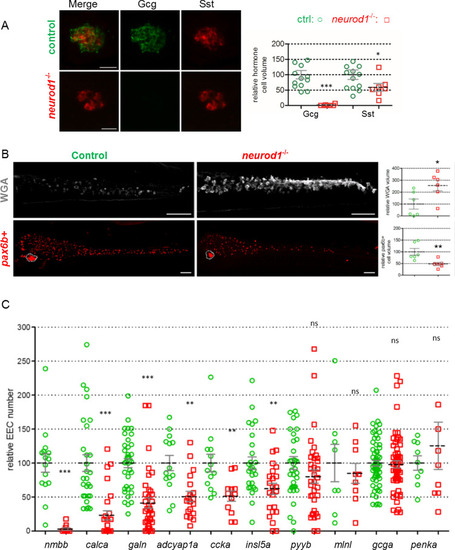
FISH performed with the
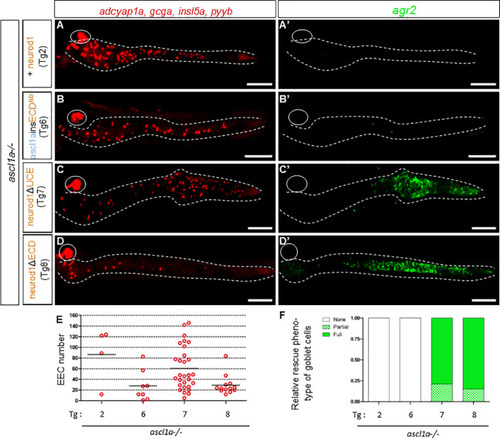
 gfi1aa probe on wild-type (B) embryos or carrying the Tg7 (Neurod1ΔUCE) (A), Tg8 (Neurod1ΔECD)(C) or Tg1 (Ascl1a) (D) transgenes. All the embryos have been heat-shocked at 48 hpf and analysed at 54 hpf. All views are lateral with the anterior part to the left and represent confocal projection images. The pancreas is encircled with yellow dashed lines while the location of the gut, visualised with a DAPI staining (not shown), is delimited by white dashed lines. Scale Bars: 50 μm.

<italic toggle='yes'>neurod1</italic><sup><italic toggle='yes'>ΔUCE</italic></sup> homozygous mutants display an increase of the goblet cells concomitant with a decrease of EECs.

Top: Schematic representation of Neurod1 and of Neurod1ΔUCE mutant, harbouring an 81-bp deletion spanning the 19aa of the UCE and 3 and 5 aa upstream and downstream of the UCE, respectively. A-C: Immunodetection of goblet cells labelled with a rhodamine dextran-conjugated wheat germ agglutinin (WGA) that interacts with the N-acetylglucosamine of the mucus. Quantification was done by counting the goblet cells under a fluorescent stereomicroscope. D-I: Immunodetection of GFP performed on pax6b:GFP transgenic embryos at 5 dpf (D-F) or 4 dpf (G-I). The location of the pancreas (p) is indicated on G and H. Quantification of the relative GFP expression was performed by quantifying the volume occupied by the GFP cells using the Imaris software. Asterisks indicate that the difference between the cell number in wt controls and neurod1ΔUCE mutants is statistically significant using the Mann-Whitney U-test (**: P <0.01; *: P <0.05). Views are lateral (A-B) or ventral (D-H) with the anterior part to the left and represent confocal projection images. Scale bars: 100μm. J-M: Subsequent 5 μm microtome sections of 5 dpf wt (J, L) or Neurod1ΔUCE mutant (K,M) larvae stained with haematoxylin/eosin (J-K) or with eosin/alcian blue (L-M). Scale Bars: 100 μm. J’-M’: enlarged view of J-M: Scale Bars: 20 μm.

<italic toggle='yes'>neurod1</italic><sup xmlns:xlink='http://www.w3.org/1999/xlink'><italic toggle='yes'>ΔUCE</italic></sup> homozygous mutants display a decrease in the expression of several EE hormones.

A1: The expression level (given in normalized CPM) of the EE hormones was obtained from the RNA-seq data of Tg(pax6b:GFP+) EEC isolated by FACS from wt or neurod1ΔUCE homozygous mutant larvae at 4 dpf. The values are the expression mean of 6 wt and 4 neurod1ΔUCE samples. Genes underlined in grey are not significantly regulated (FDR > 0.1). S3 Table provides the expression level of all differentially expressed genes (values for each sample, means, log2 FC and FDR). A2. Log2 fold change (FC) and FDR in the hormone cell number observed in wt compared to neurod1ΔUCE homozygous mutant embryos as quantified on Fig 9B. A3. Log2 FC and FDR in the hormone cell number observed in control siblings compared to neurod1-/- homozygous mutant embryos as shown on Fig 11C. Grey zones indicate non-significant change: FDR >0.05). B: Quantification of the number of EECs detected either by FISH performed at 96hpf with mlnl, adcyap1a, insl5a, gcga, galn and pyyb probes or by immunodetection of Penka cells on wt or neurod1ΔUCE homozygous mutant embryos. Quantification was done by counting the cells using the Imaris software after confocal scanning except for mlnl were the cells were directly counted under a fluorescent stereomicroscope. The mean is indicated by a dashed line and the S.E by solid lines. Asterisks indicate that the difference between the cell number in wt controls and neurod1ΔUCE mutants is statistically significant using the Mann-Whitney U-test (***: P <0.001; **: P <0.01; *: P <0.05, ns: P >0.05).

Expression level of selected transcription factors in EEC from wild-type or <italic toggle='yes'>neurod1</italic><sup><italic toggle='yes'>ΔUCE</italic></sup> homozygous mutant larvae.

A: Expression level for 12 “endocrine pancreas development” genes. B: Expression level of selected genes differentially up-regulated by neurod1ΔUCE. The expression level (given in normalized CPM) was obtained from the RNA-seq data of pax6b:GFP+ EEC isolated by FACS from wt or neurod1ΔUCE homozygous mutant larvae at 4 dpf. The values are the expression mean of 6 wt and 4 neurod1ΔUCE replicates. Genes underlined in grey are not significantly regulated (FDR > 0.1). S3 Table provides the expression level of all differentially expressed genes (values for each sample, means, log2 FC and FDR).

<italic toggle='yes'>neurod1</italic><sup>-/-</sup> displays an increase of goblet cells concomitant with a reduction of EECs.

A: Immunodetection at 96hpf of Gcg and Sst cells of neurod1-/- homozygous mutant compared to control sibling embryos. Quantification was performed by quantifying the volume occupied by the cells using the Imaris software. Views represent confocal projection images. Scale bars: 20 μm. B: Immunodetection at 96hpf of goblet cells (WGA) or pax6b+ cells of neurod1ΔUCE homozygous mutant compared to control sibling embryos. Quantification was performed by quantifying the volume occupied by the cells using the Imaris software. Views represent confocal projection images with the anterior part to the left. The pancreas are encircled with dotted lines. Scale bars: 50 μm. C: Quantification of the relative number of EECs detected by FISH performed at 96hpf on neurod1ΔUCE homozygous mutant compared to control sibling embryos. Quantification was done by counting the cells under a fluorescent stereomicroscope. The mean is indicated by a dashed line and the S.E by solid lines. Asterisks indicate that the differences between controls and neurod1-/- mutants are statistically significant using the Mann-Whitney U-test (***: P <0.001; **: P <0.01; *: P <0.05, ns: P >0.05).

Acknowledgments
This image is the copyrighted work of the attributed author or publisher, and ZFIN has permission only to display this image to its users. Additional permissions should be obtained from the applicable author or publisher of the image. Full text @ PLoS Genet.