|
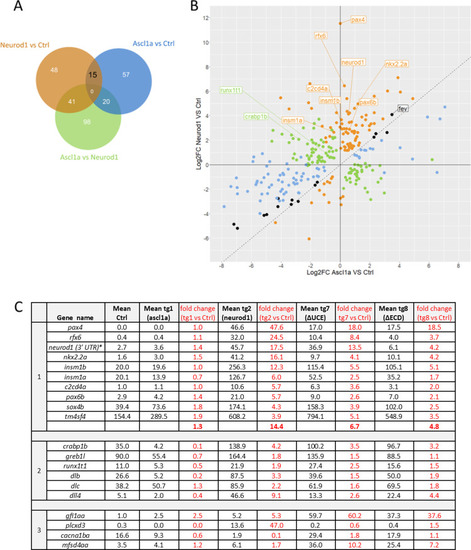
Comparison of the differentially expressed genes.A: Venn diagram showing the differentially expressed genes for Neurod1 (Tg2) and for ascl1a (Tg1) compared to Ctrl and for Ascl1a vs Neurod1 (FDR ≤ 0,1). B: Plot showing the log2 Fold Change after overexpression of Ascl1a (Tg1) (x-axis) and Neurod1 (Tg2) (y-axis) compared to Ctrl embryos for the 209 DE genes. Genes in blue represent significant Ascl1a DE, in orange, Neurod1 DE and genes in black correspond to genes significantly DE in both conditions. Genes in green represent the 98 additional DE genes identified through the direct comparison of Neurod1- versus Ascl1a-induced samples. C: Expression level of selected DE genes. The expression level (given in normalized CPM) was obtained from the RNA-seq data from Ctrl or hsp70l transgenic lines for Ascl1a (Tg1), Neurod1 (Tg2), Neurod1ΔUCE (Tg7) and Neurod1ΔECD (Tg8) embryos, all heat-shocked at 38 and 48 hpf and harvested at 52 hpf. The values are the expression mean of at least triplicate samples. Panel 1: Expression level for the 10 “endocrine pancreas development” genes. Panel 2: Expression level of selected genes differentially regulated by Neurod1 compared to Ascl1a. Panel 3. Expression level of selected genes differentially regulated by Neurod1ΔUCE and Neurod1ΔECD compared to Neurod1.
|