
- Title
-
Clusters of neuronal neurofascin prefigure the position of a subset of nodes of Ranvier along individual central nervous system axons in vivo
- Authors
- Vagionitis, S., Auer, F., Xiao, Y., Almeida, R.G., Lyons, D.A., Czopka, T.
- Source
- Full text @ Cell Rep.
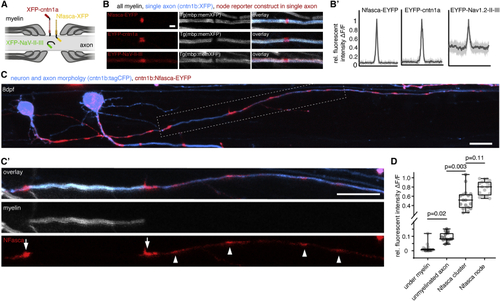
Localization of transgenic node of Ranvier reporters along unmyelinated and myelinated axon stretches (A) Schematic of node of Ranvier reporter constructs used. (B) Confocal images of nodal reporters along individually labeled myelinated axons in transgenic animals that have all myelin labeled. Scale bar, 2 μm. (B′) Fluorescence intensity traces of each reporter around the node. Bold lines represent mean, shaded areas SD; n = 3/3 (Nfasca), 4/3 (Cntn1a), and 5/4 (NaV-II-III) animals/technical replicates. (C) Individually partially myelinated axon at 8 dpf co-expressing cntn1b:Nfasca-EYFP in a full transgenic myelin reporter background. (C′) Magnification of the boxed area in (C). Arrowheads indicate Nfasca-EYFP clusters along unmyelinated axon parts. Arrows point to heminodal Nfasca-EYFP. Scale bars, 10 μm. (D) Fluorescence intensity quantifications at different regions. Median ± IQR (Kruskal-Wallis test with multiple comparisons); n = 7/7 animals/technical replicates. See also EXPRESSION / LABELING:
|
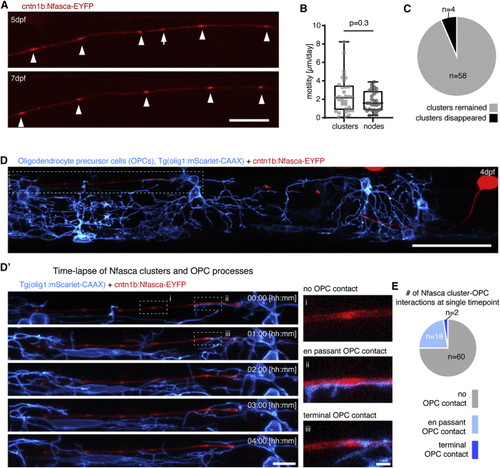
Clusters of neuronal neurofascin are stable over time and do not co-localize with processes of oligodendrocyte precursor cells (A) Individual unmyelinated axon expressing Nfasca-EYFP at two different time points. Arrowheads depict stable clusters and the arrow points to a cluster that disappears between time points. Scale bar, 20 μm. (B) Quantification of Nfasca cluster and node motility. Median ± IQR (Mann-Whitney test); n = 5/5 (cluster motility) and 9/6 (node motility) animals/technical replicates. (C) Frequency of cluster disappearance. (D) Axon expressing Nfasca-EYFP in a transgenic animal that has all OPCs labeled. Scale bar, 50 μm. (D′) (Left) Magnification of the boxed area in (D) showing OPC processes in relation to Nfasca-EYFP accumulations over time. Scale bar, 10 μm. (Right, i–iii) Examples of possible cluster-OPC process interactions. Scale bar, 2 μm. (E) Quantification of the frequency of cluster-OPC process interactions; n = 4/2 animals/technical replicates. See also |

Clusters of neuronal neurofascin correlate with future node position and restrict myelin sheath extension (A) Quantification of intercluster and internodal distances along single axons. Data are expressed as mean ± SD (unpaired t test); n = 4/3 animals/technical replicates. (B) Example images of two individual myelinated areas (dashed lines) forming a node at their left side (asterisk), and the presence (top, arrowhead) and absence (bottom, arrow) of Nfasca-EYFP heminodal accumulation at their right sheath end. Pie chart shows frequency of observations; n = 5/3 animals/technical replicates. Scale bars, 10 μm. (C) Length of Nfasca-EYFP positive and negative sheath ends. Data derived from both (D–D‴) Individual axon expressing Nfasca-EYFP at different time points. Dashed lines indicate myelin sheaths. Arrows depict Nfasca clusters, arrowheads point to heminodes, and asterisks depict nodes of Ranvier. Scale bars, 10 μm. (E) Possible cluster fates and quantification of frequencies observed by time lapse imaging; n = 5/3 animals/technical replicates. (F) Modeling of cluster fates and predicted co-localization with nodes when random positioning is assumed. The shaded curve shows the probability distribution for the simulated values (gray line indicates the mean of simulated data). The light red and dark red lines indicate the quantified cluster fates analysis shown in (E). See also |
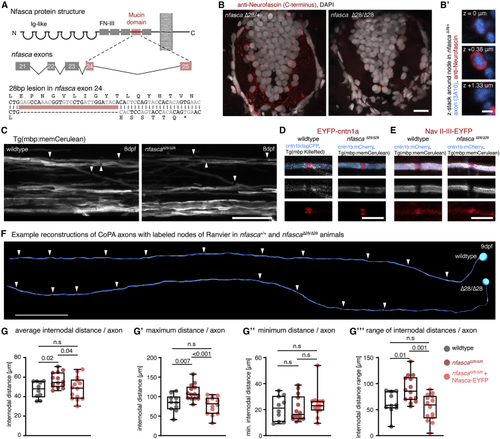
Increased and less regular nodal spacing along individual axons in (A) Targeting strategy and genetic lesion in (B) Immunohistochemistry against Nfasca on spinal cord cross-sections in adult heterozygous and homozygous (C) Overviews of the spinal cord in full transgenic myelin reporter lines. Arrowheads highlight gaps between adjacent myelin sheaths. Scale bar, 20 μm. (D and E) Close-up views showing single nodes of Ranvier marked with EYFP-cntn1a and EYFP-NaV-II-III in full transgenic myelin reporter lines. Scale bar, 5 μm. (F) Reconstructions of two CoPA neurons and their node of Ranvier positions (arrowheads) from wild type and (G) Average internodal distances along single axons per axon in wild type, (G′–G‴) Maximum (G′), minimum (G″), and range (G‴) of internodal distances per axon as quantified in (G). Median with IQR; Brown-Forsythe ANOVA with multiple comparisons for (G′ and G‴), Kruskal-Wallis test with multiple comparisons for (G″). See also |