
Figure 2
- ID
- ZDB-FIG-220302-79
- Publication
- Vagionitis et al., 2022 - Clusters of neuronal neurofascin prefigure the position of a subset of nodes of Ranvier along individual central nervous system axons in vivo
- Other Figures
- All Figure Page
- Back to All Figure Page
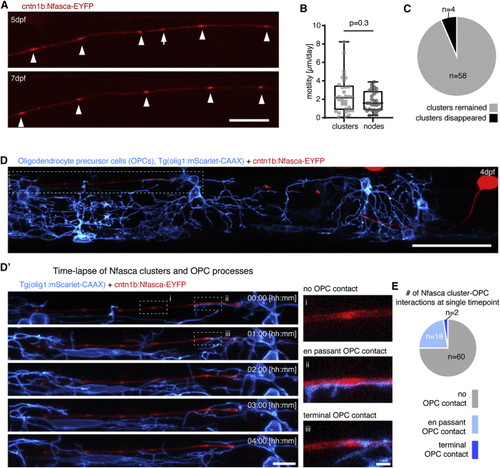
Clusters of neuronal neurofascin are stable over time and do not co-localize with processes of oligodendrocyte precursor cells (A) Individual unmyelinated axon expressing Nfasca-EYFP at two different time points. Arrowheads depict stable clusters and the arrow points to a cluster that disappears between time points. Scale bar, 20 μm. (B) Quantification of Nfasca cluster and node motility. Median ± IQR (Mann-Whitney test); n = 5/5 (cluster motility) and 9/6 (node motility) animals/technical replicates. (C) Frequency of cluster disappearance. (D) Axon expressing Nfasca-EYFP in a transgenic animal that has all OPCs labeled. Scale bar, 50 μm. (D′) (Left) Magnification of the boxed area in (D) showing OPC processes in relation to Nfasca-EYFP accumulations over time. Scale bar, 10 μm. (Right, i–iii) Examples of possible cluster-OPC process interactions. Scale bar, 2 μm. (E) Quantification of the frequency of cluster-OPC process interactions; n = 4/2 animals/technical replicates. See also |
| Genes: | |
|---|---|
| Fish: | |
| Anatomical Terms: | |
| Stage Range: | Day 4 to Days 7-13 |
| Fish: | |
|---|---|
| Observed In: | |
| Stage: | Day 4 |