
|
Figure 2
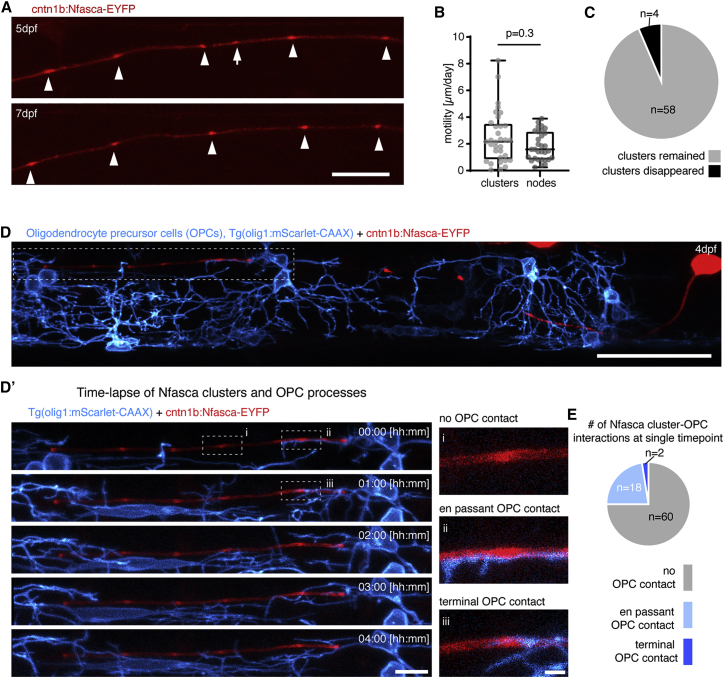
Clusters of neuronal neurofascin are stable over time and do not co-localize with processes of oligodendrocyte precursor cells
(A) Individual unmyelinated axon expressing Nfasca-EYFP at two different time points. Arrowheads depict stable clusters and the arrow points to a cluster that disappears between time points. Scale bar, 20 μm.
(B) Quantification of Nfasca cluster and node motility. Median ± IQR (Mann-Whitney test); n = 5/5 (cluster motility) and 9/6 (node motility) animals/technical replicates.
(C) Frequency of cluster disappearance.
(D) Axon expressing Nfasca-EYFP in a transgenic animal that has all OPCs labeled. Scale bar, 50 μm. (D′) (Left) Magnification of the boxed area in (D) showing OPC processes in relation to Nfasca-EYFP accumulations over time. Scale bar, 10 μm. (Right, i–iii) Examples of possible cluster-OPC process interactions. Scale bar, 2 μm.
(E) Quantification of the frequency of cluster-OPC process interactions; n = 4/2 animals/technical replicates.
See also