
|
Figure 3
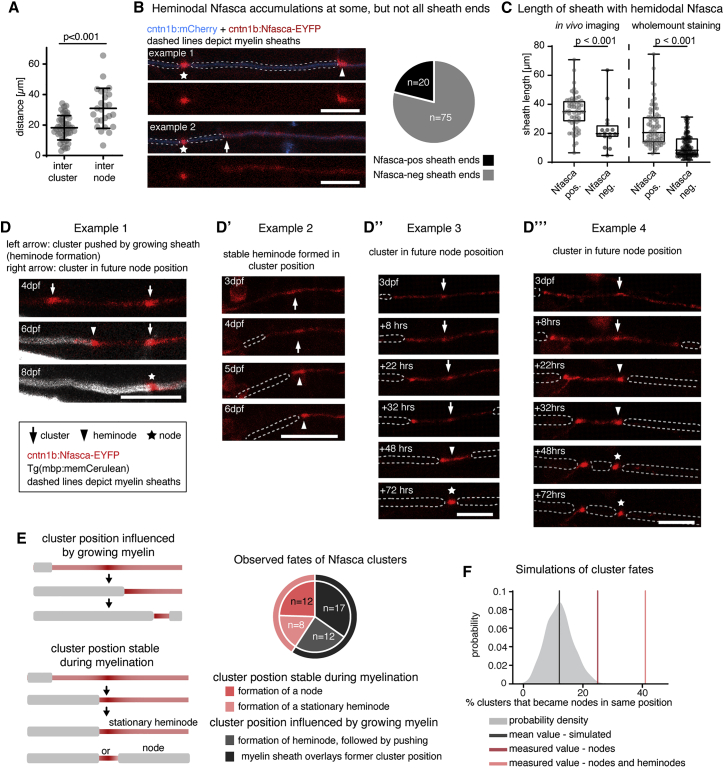
Clusters of neuronal neurofascin correlate with future node position and restrict myelin sheath extension
(A) Quantification of intercluster and internodal distances along single axons. Data are expressed as mean ± SD (unpaired t test); n = 4/3 animals/technical replicates.
(B) Example images of two individual myelinated areas (dashed lines) forming a node at their left side (asterisk), and the presence (top, arrowhead) and absence (bottom, arrow) of Nfasca-EYFP heminodal accumulation at their right sheath end. Pie chart shows frequency of observations; n = 5/3 animals/technical replicates. Scale bars, 10 μm.
(C) Length of Nfasca-EYFP positive and negative sheath ends. Data derived from both
(D–D‴) Individual axon expressing Nfasca-EYFP at different time points. Dashed lines indicate myelin sheaths. Arrows depict Nfasca clusters, arrowheads point to heminodes, and asterisks depict nodes of Ranvier. Scale bars, 10 μm.
(E) Possible cluster fates and quantification of frequencies observed by time lapse imaging; n = 5/3 animals/technical replicates.
(F) Modeling of cluster fates and predicted co-localization with nodes when random positioning is assumed. The shaded curve shows the probability distribution for the simulated values (gray line indicates the mean of simulated data). The light red and dark red lines indicate the quantified cluster fates analysis shown in (E).
See also