
- Title
-
Uveal Melanoma Cell Line Proliferation Is Inhibited by Ricolinostat, a Histone Deacetylase Inhibitor
- Authors
- Sundaramurthi, H., García-Mulero, S., Tonelotto, V., Slater, K., Marcone, S., Piulats, J.M., Watson, R.W., Tobin, D.J., Jensen, L.D., Kennedy, B.N.
- Source
- Full text @ Cancers
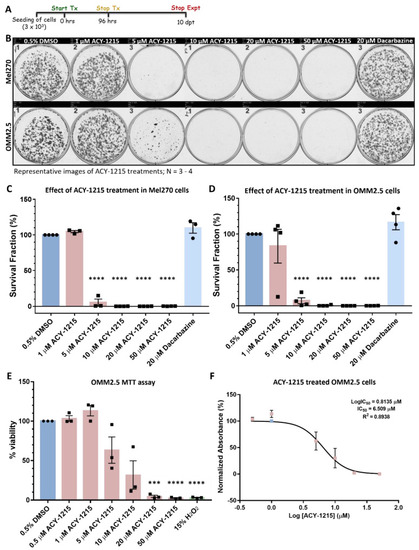
ACY-1215 is efficacious as an anti-cancer drug in primary UM and metastatic UM cell lines. (A): Schematic diagram on the treatment regime followed. Days post treatment (dpt). (B): Representative image of clonogenic assay plates for Mel270 (top panel) and OMM2.5 cells (bottom panel) treated with 0.5% DMSO; 1, 5, 10, 20 or 50 μM ACY-1215 or 20 μM Dacarbazine for 96 h. (C,D): A dose-dependent, significant decrease in the surviving number of OMM2.5 colonies was observed, indicative of reduction in cell viability upon ACY-1215 treatment in comparison to 0.5% DMSO treatment. (E): A dose-dependent, significant decrease in OMM2.5 cell viability was observed following 96 h of ACY-1215 treatment in comparison to 0.5% DMSO treatment. (F): IC50 value of ACY-1215 in OMM2.5 cell viability assays. One-way ANOVA with Dunnett’s Test for Multiple Comparisons statistical analysis was performed; error bars represent mean ± SEM, *** p value of 0.001, **** p value of 0.0001 (N = 3–4). |

ACY-1215 demonstrates anti-cancer effects in vivo in zebrafish OMM2.5 xenografts. (A): Schematic depicting the workflow for assessing ACY-1215 effects in vivo. (B): Top panel shows representative images of Dil-labeled OMM2.5 cells transplanted into the perivitelline space of 2-day-old zebrafish larvae. Bottom panels present representative images of the distribution of OMM2.5 Dil-labeled cells in xenografts 3 days post treatment (dpt), with 0.5% DMSO (n = 30), 20 μM ACY-1215 (n = 31) or 20 μM Dacarbazine (n = 27). Days post fertilization (dpf). (C): At 3 dpt, OMM2.5 Dil-labeled cells have disseminated (white arrowhead) to the caudal vein plexus of the zebrafish larvae. (D): ACY-1215 treatment for 3 days resulted in a significant (****, p = 0.0001) reduction in normalized primary xenograft fluorescence on average in comparison to larvae treated with 0.5% DMSO or 20 μM Dacarbazine. (E): There was no observed difference in the average number of disseminated cells between vehicle control-treated or drug-treated groups after 3 days. Statistical analysis was performed using one-way ANOVA with Dunnett’s Test for Multiple Comparisons, and error bars present mean ± SEM. |

Expression and activity of HDAC6 in UM/MUM cells. (A,A’): HDAC6 is expressed in Mel270, OMM2.5, Mel285 and ARPE19 cells (N = 3). (B,B’): 20 μM ACY-1215 treatment significantly increased acetylated α-tubulin expression levels at 4 h post treatment (hpt) (**, p = 0.0013) and 24 hpt (***, p = 0.0002) compared to 0.5% DMSO treatment. Student’s Unpaired T test statistical analysis was performed, and data are presented as mean ± SEM. Representative blots for each protein probed and densitometry analysis presented, plus raw blots are provided in Supplementary Figures S3 and S7. (C): Kaplan–Meier survival curves assessing correlation between expression of HDAC6 and overall survival (OS) or progression-free survival (PFS) in UM patients. Median values were used as cut-off for high (red) and low (blue) expression levels, with Log-rank p-values (categorical variable) and Cox p-values (continuous variable) calculated (n = 80). |

Proteome profiling of ACY-1215-treated cells to uncover mechanism of action. (A): ACY-1215 treatment regime for proteome profiling of OMM2.5 cells. Hours post treatment (hpt). (B): Heat map showing all significant differentially expressed proteins at 24 h post 20 μM ACY-1215 treatment in OMM2.5 cells. A total of 4423 proteins were identified in MS, with 150 downregulated (blue) and 202 upregulated (red) proteins (N = 4). (C,D): Enriched protein pathway analysis for GO term: biological processes for down and upregulated proteins, given a fold change cut off of +/− ≥ 1.2, p ≤ 0.05 displayed as pie charts. *, p < 0.05 and **, p < 0.01 denotes GO-term significance. |
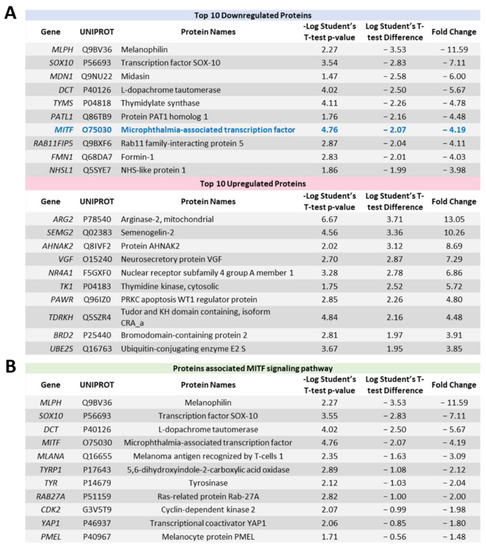
Significantly altered proteins identified by proteomic profiling following ACY-1215 treatment in OMM2.5 cells for 24 h. (A): Table highlighting the top 10 most down and upregulated proteins at 24 h post treatment (hpt) with 20 μM ACY-1215. (B): List of proteins involved in the MITF signaling pathway that were downregulated upon 20 μM ACY-1215 treatment for 24 h. |
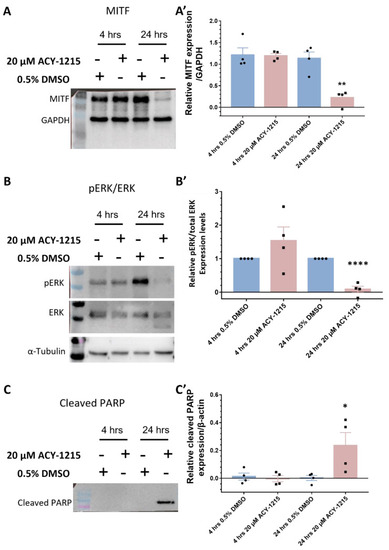
Western blot validation of proteomics data in OMM2.5 cells. (A,A’): There was no change in MITF expression levels after 4 h of 20 μM ACY-1215 treatment, while treatment for 24 h with 20 μM ACY-1215 led to a significant (**, p = 0.002) reduction in MITF expression levels. (B,B’): Relative expression levels of p-ERK to total ERK remained unchanged after 20 μM ACY-1215 treatment for 4 h. At 24 h post treatment with 20 μM ACY-1215, relative expression levels of p-ERK to total ERK were significantly (****, p < 0.0001) downregulated when compared to the 0.5% DMSO treatment. (C,C’): Expression of cleaved PARP was significantly (*, p = 0.049) upregulated after 24 h treatment with 20 μM ACY-1215 in comparison to 0.5% DMSO-treated OMM2.5 cells. Representative blots for each protein probed and densitometry analysis presented, raw blots are provided in Supplementary Figure S7. β-actin, GAPDH or α-tubulin were used as loading controls. Student’s Unpaired T test statistical analysis was performed, and data presented as mean ± SEM. |
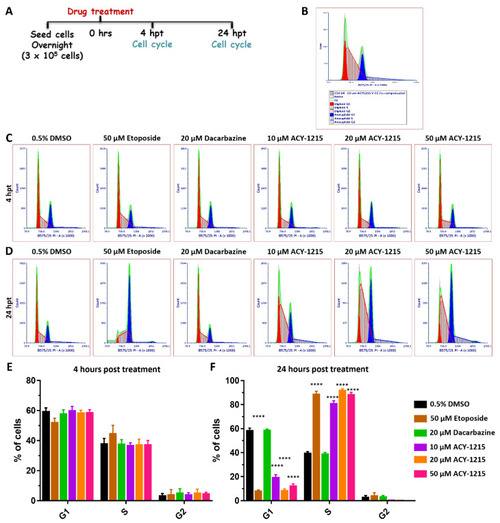
Cell cycle progression is arrested in the S phase by ACY-1215 in OMM2.5 cells. (A): Schematic illustrating treatment protocol undertaken. Hours post treatment (hpt). (B): Flow cytometry data analysis plot legend. (C,E): 4 h of treatment with 10, 20 or 50 μM ACY-1215, or 50 μM Etoposide or 20 μM Dacarbazine did not alter the cell cycle profile. (D,F): A significant (****, p = 0.0001) reduction in the percentage of cells in G1 phase and a significant (****, p = 0.0001) increase in the percentage of cells in the S phase were observed after 24 hpt with 10, 20 or 50 μM ACY-1215 or 50 μM Etoposide, in comparison to vehicle control. No changes in the cell cycle phases were observed following 20 μM Dacarbazine treatment. No alterations to G2 phase were observed in all treatment groups. Statistical analysis was performed by two-way ANOVA with Dunnett’s Test for Multiple Comparisons and data represented as mean ± SEM (N = 4). |
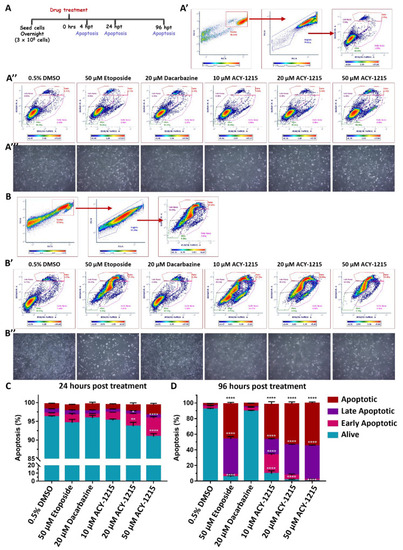
ACY-1215 activates the apoptotic pathway in OMM2.5 cells. (A): Diagram portraying treatment regime. Hours post treatment (hpt). (A’,B): Plots representing gating of cell singlets into different stages of apoptosis. (A’’,B’): Representative plots depicting OMM2.5 treated with 0.5% DMSO; 10, 20 or 50 μM ACY-1215; 50 μM Etoposide or 20 μM Dacarbazine, at 24 and 96 hpt, respectively. (A’’’,B’’): Representative micrographs of OMM2.5 cells at 24 and 96 h post treatment. (C): A significant reduction in the percentage of live cells and a significant increase in the percentage of early apoptotic cells was detected following 20 μM (**, p = 0.005 and *, p = 0.017, respectively) and 50 μM (****, p < 0.0001) ACY-1215 treatment compared to 0.5% DMSO treatment. (D): Live cell populations were significantly (****, p < 0.0001) reduced, and cell populations in late apoptotic stage and apoptotic stage were significantly (****, p < 0.0001) increased upon 50 μM Etoposide and all concentrations of ACY-1215 tested. The 10 μM ACY-1215 treatment resulted in a significant increase in the early apoptotic cell population compared to 0.5% DMSO. The 20 μM Dacarbazine treatment was comparable to vehicle control plots. Statistical analysis by two-way ANOVA, followed by Tukey’s Multiple Comparisons test, with error bars shown as mean ± SEM (N = 3). |

Inhibition of MITF pathway reduces OMM2.5 cell proliferation in vitro. (A): Schematic diagram of treatment regime. Days post treatment (dpt). (B): Chemical structure of ML329, a small molecule MITF pathway inhibitor. (C): Representative image of clonogenic assay plates for OMM2.5 cells treated with 0.5% DMSO, 0.05–50 μM ML329, 20 μM Dacarbazine or 20 μM ACY-1215 for 96 h. (D): A dose-dependent, significant reduction in the number of OMM2.5 colonies was observed in ML329 treatment groups compared to the 0.5% DMSO treatment group. One-way ANOVA with Dunnett’s Test for Multiple Comparisons statistical analysis was performed; error bars represent mean ± SEM, **, p = 0.005, ****, p = 0.0001 (N = 3–4). (E): Kaplan–Meier survival curves demonstrating no correlation between expression of MITF and overall survival (OS) or progression-free survival (PFS) in UM patients. Median values were used as cut-off for high (red) and low (blue) expression levels, with Log-rank p-values (categorical variable) and Cox p-values (continuous variable) calculated (n = 80). |
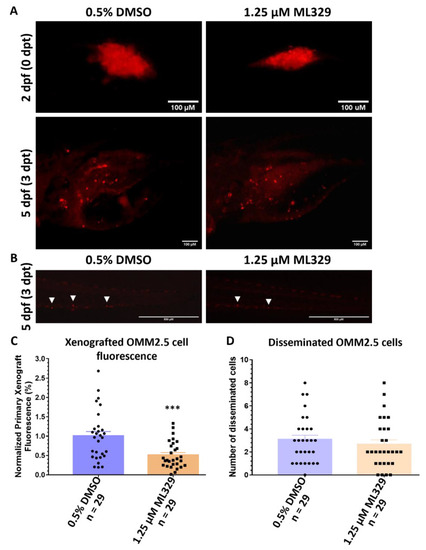
ML329 demonstrates anti-UM properties in zebrafish OMM2.5 xenografts. (A): Top panel shows OMM2.5 Dil-labeled cells xenografted into the perivitelline space of 2-day-old zebrafish larvae. Bottom panel presents zebrafish larvae 3 days post treatment (dpt) with 0.5% DMSO (n = 29) or 1.25 μM ML329 (n = 29). Days post fertilization (dpf). (B). Representative image of OMM2.5 Dil-labeled cells disseminated (white arrowhead) to the caudal vein plexus of zebrafish larvae at 3 dpt. (C): A significant (***, p = 0.0006) regression of the average normalized primary xenograft fluorescence of OMM2.5 Dil-labeled cells was observed when treated with 1.25 μM ML329. (D): No difference was detected in the average number of disseminated OMM2.5 Dil cells following treatment with 1.25 μM ML329 compared to vehicle control. Student’s T test was used for statistical analysis, with error bars presenting mean ± SEM. |