
Figure 8
- ID
- ZDB-FIG-220219-95
- Publication
- Sundaramurthi et al., 2022 - Uveal Melanoma Cell Line Proliferation Is Inhibited by Ricolinostat, a Histone Deacetylase Inhibitor
- Other Figures
- All Figure Page
- Back to All Figure Page
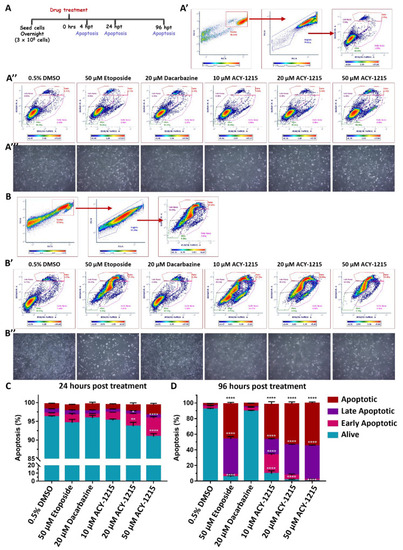
ACY-1215 activates the apoptotic pathway in OMM2.5 cells. (A): Diagram portraying treatment regime. Hours post treatment (hpt). (A’,B): Plots representing gating of cell singlets into different stages of apoptosis. (A’’,B’): Representative plots depicting OMM2.5 treated with 0.5% DMSO; 10, 20 or 50 μM ACY-1215; 50 μM Etoposide or 20 μM Dacarbazine, at 24 and 96 hpt, respectively. (A’’’,B’’): Representative micrographs of OMM2.5 cells at 24 and 96 h post treatment. (C): A significant reduction in the percentage of live cells and a significant increase in the percentage of early apoptotic cells was detected following 20 μM (**, p = 0.005 and *, p = 0.017, respectively) and 50 μM (****, p < 0.0001) ACY-1215 treatment compared to 0.5% DMSO treatment. (D): Live cell populations were significantly (****, p < 0.0001) reduced, and cell populations in late apoptotic stage and apoptotic stage were significantly (****, p < 0.0001) increased upon 50 μM Etoposide and all concentrations of ACY-1215 tested. The 10 μM ACY-1215 treatment resulted in a significant increase in the early apoptotic cell population compared to 0.5% DMSO. The 20 μM Dacarbazine treatment was comparable to vehicle control plots. Statistical analysis by two-way ANOVA, followed by Tukey’s Multiple Comparisons test, with error bars shown as mean ± SEM (N = 3). |