
Figure 6
- ID
- ZDB-FIG-220219-93
- Publication
- Sundaramurthi et al., 2022 - Uveal Melanoma Cell Line Proliferation Is Inhibited by Ricolinostat, a Histone Deacetylase Inhibitor
- Other Figures
- All Figure Page
- Back to All Figure Page
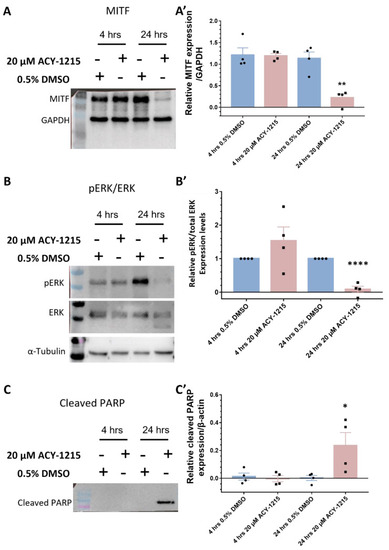
Western blot validation of proteomics data in OMM2.5 cells. (A,A’): There was no change in MITF expression levels after 4 h of 20 μM ACY-1215 treatment, while treatment for 24 h with 20 μM ACY-1215 led to a significant (**, p = 0.002) reduction in MITF expression levels. (B,B’): Relative expression levels of p-ERK to total ERK remained unchanged after 20 μM ACY-1215 treatment for 4 h. At 24 h post treatment with 20 μM ACY-1215, relative expression levels of p-ERK to total ERK were significantly (****, p < 0.0001) downregulated when compared to the 0.5% DMSO treatment. (C,C’): Expression of cleaved PARP was significantly (*, p = 0.049) upregulated after 24 h treatment with 20 μM ACY-1215 in comparison to 0.5% DMSO-treated OMM2.5 cells. Representative blots for each protein probed and densitometry analysis presented, raw blots are provided in Supplementary Figure S7. β-actin, GAPDH or α-tubulin were used as loading controls. Student’s Unpaired T test statistical analysis was performed, and data presented as mean ± SEM. |