
|
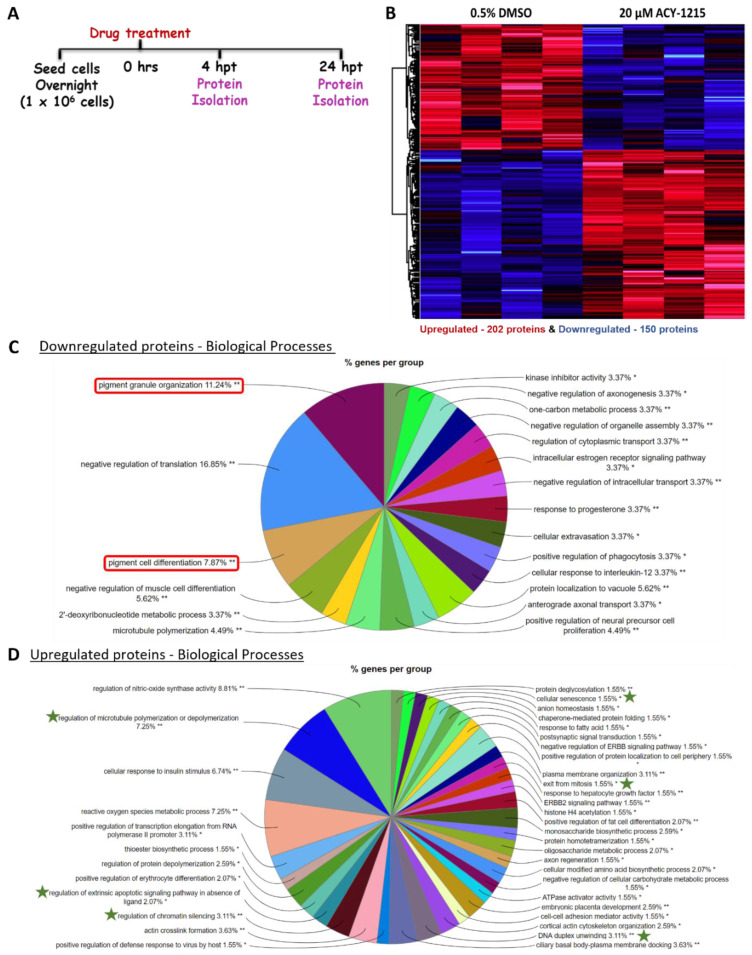
Figure 4
Proteome profiling of ACY-1215-treated cells to uncover mechanism of action. (A): ACY-1215 treatment regime for proteome profiling of OMM2.5 cells. Hours post treatment (hpt). (B): Heat map showing all significant differentially expressed proteins at 24 h post 20 μM ACY-1215 treatment in OMM2.5 cells. A total of 4423 proteins were identified in MS, with 150 downregulated (blue) and 202 upregulated (red) proteins (N = 4). (C,D): Enriched protein pathway analysis for GO term: biological processes for down and upregulated proteins, given a fold change cut off of +/− ≥ 1.2, p ≤ 0.05 displayed as pie charts. *, p < 0.05 and **, p < 0.01 denotes GO-term significance.