
- Title
-
Neuroprotective effects of Tongtian oral liquid, a Traditional Chinese Medicine in the Parkinson's disease-induced zebrafish model
- Authors
- Dongjie, S., Rajendran, R.S., Xia, Q., She, G., Tu, P., Zhang, Y., Liu, K.
- Source
- Full text @ Biomed. Pharmacother.
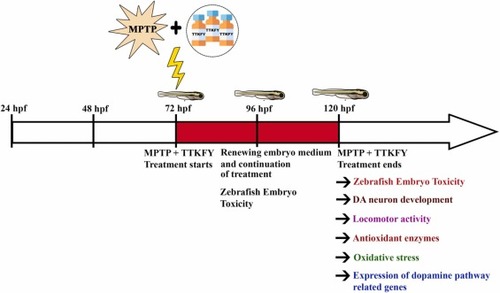
Fig. 1. Flow chart for experimental design. Larvae at 72 hpf were co-exposed to MPTP and four different concentrations of TTKFY from 72 to 120 hpf. At 120 hpf, the following parameters were undertaken in the zebrafish larvae: Mortality, DA neuron development, locomotor activity, antioxidant enzymes’ activities, oxidative stress and genes involved in the dopamine pathway. |
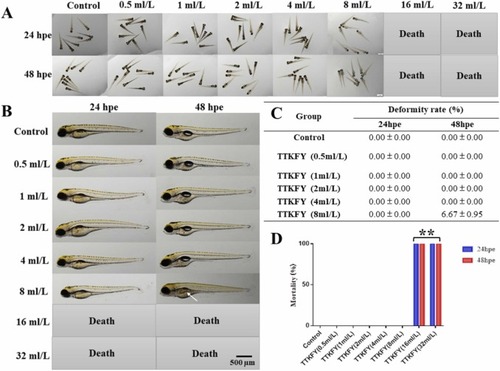
Fig. 2. The effects of TTKFY on the mortality and malformations in zebrafish embryos. (A) The overall developmental morphology of zebrafish at 24–48 hpe. (B) The developmental morphology of a single zebrafish at 24–48 hpe. The white arrow indicates the missing swim bladder. (C) The deformity rate of zebrafish juveniles at 24–48 hpe. (D) Mortality of zebrafish at 24–48hpe. TTKFY – Tongtian oral liquid. compared with the blank control group, **P < 0.01. |
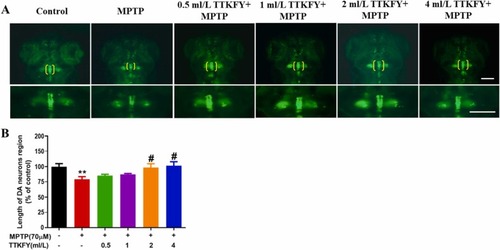
Fig. 3. The effects of TTKFY on MPTP-induced zebrafish dopamine neuron development. (A) Representative fluorescence microscopic images of vmat2:GFP transgenic zebrafish were exposed to MPTP(70 µM), MPTP + TTKFY(0.5 ml), MPTP + TTKFY(1 ml), MPTP + TTKFY(2 ml) MPTP+ TTKFY(4 ml) groups. Dopaminergic neurons are labeled in green in vmat2:GFP. Dopamine ganglions were indicated by the yellow brackets. Enlarged images are shown to make better visualization of dopamine ganglions morphology. Scale bar is 100 µm. (B) Statistical analysis of length of DA neuron region in each group, n = 8. Data are expressed as a percentage of the control group. Compared with control group, **P < 0.01, compared with the MPTP treatment group, #P < 0.05. PHENOTYPE:
|
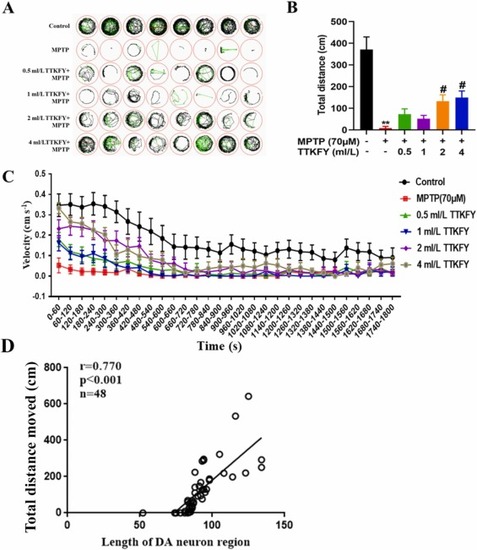
Fig. 4. Neuroprotective effect of TTKFY on MPTP-induced locomotion impairments in zebrafish. (A) The digital track map. Red, green, and black lines represent fast, medium, and slow movement trajectories, respectively. n = 8 per group. (B) The total distance moved in control, MPTP, and MPTP + TTKFY groups. n = 8 per group. (C) Average movement speed of larvae for different treatment groups. n = 8 per group. Average speed in every 60 s was calculated. TTKFY – Tongtian oral liquid. **P < 0.01, compared with the MPTP treatment group, #P < 0.05. (D) Pearson’s Correlation Coefficient analysis reveals the positive correlation between locomotor dysfunction and the percentage of decrease of DAnergic neurons. Correlation is significant at the level of P < 0.001. PHENOTYPE:
|
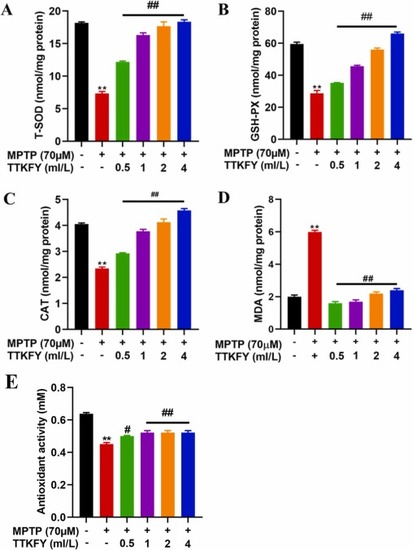
Fig. 5. Measurement of T-SOD, GSH-PX, CAT, T-AOC activities and MDA concentration (A) T-SOD (B) GSH-Px (C) CAT (D) Lipid peroxidation was measured in terms of MDA level and (E) T-AOC, Total antioxidant capacity. TTKFY – Tongtian oral liquid. Compared with the blank control group, **P < 0.01; compared with the MPTP treatment group, #P < 0.05, ##P < 0.01. PHENOTYPE:
|
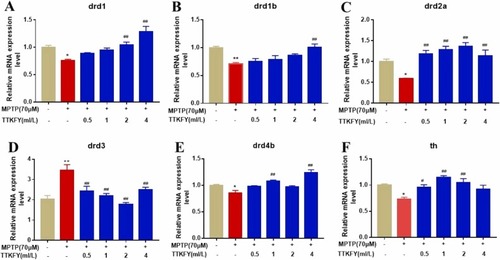
Fig. 6. Expression of dopamine pathway related genes in zebrafish larvae at 120 hpf. (A–F) The relative mRNA expression levels of dopamine-related pathway (A) drd1, (B) drd1b, (C) drd2a, (D) drd3, (E) drd4b and (F) th1. Compared with the control group, *P < 0.05, **P < 0.01; Compared with the MPTP treatment group, #P < 0.05, ##P < 0.01. |