
|
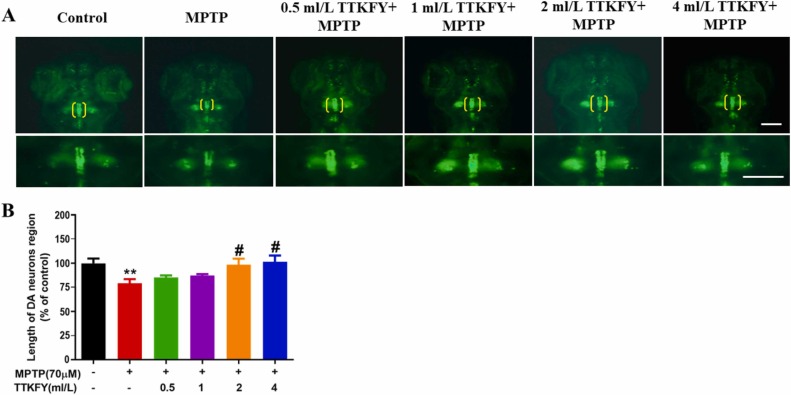
Fig. 3 Fig. 3. The effects of TTKFY on MPTP-induced zebrafish dopamine neuron development. (A) Representative fluorescence microscopic images of vmat2:GFP transgenic zebrafish were exposed to MPTP(70 µM), MPTP + TTKFY(0.5 ml), MPTP + TTKFY(1 ml), MPTP + TTKFY(2 ml) MPTP+ TTKFY(4 ml) groups. Dopaminergic neurons are labeled in green in vmat2:GFP. Dopamine ganglions were indicated by the yellow brackets. Enlarged images are shown to make better visualization of dopamine ganglions morphology. Scale bar is 100 µm. (B) Statistical analysis of length of DA neuron region in each group, n = 8. Data are expressed as a percentage of the control group. Compared with control group, **P < 0.01, compared with the MPTP treatment group, #P < 0.05.