
Image
|
Figure Caption
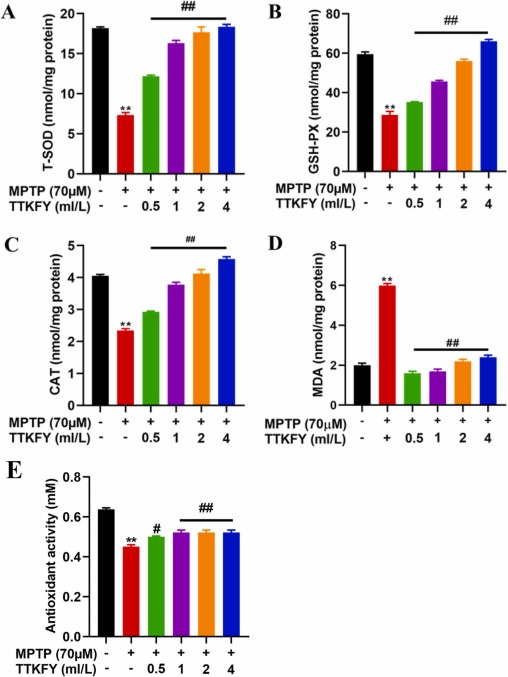
Fig. 5 Fig. 5. Measurement of T-SOD, GSH-PX, CAT, T-AOC activities and MDA concentration (A) T-SOD (B) GSH-Px (C) CAT (D) Lipid peroxidation was measured in terms of MDA level and (E) T-AOC, Total antioxidant capacity. TTKFY – Tongtian oral liquid. Compared with the blank control group, **P < 0.01; compared with the MPTP treatment group, #P < 0.05, ##P < 0.01.
Figure Data
Acknowledgments
This image is the copyrighted work of the attributed author or publisher, and
ZFIN has permission only to display this image to its users.
Additional permissions should be obtained from the applicable author or publisher of the image.
Full text @ Biomed. Pharmacother.