
Image
|
Figure Caption
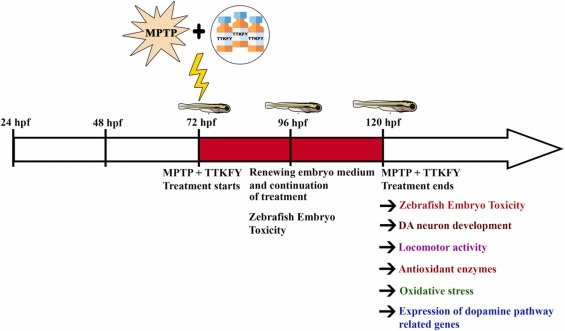
Fig. 1 Fig. 1. Flow chart for experimental design. Larvae at 72 hpf were co-exposed to MPTP and four different concentrations of TTKFY from 72 to 120 hpf. At 120 hpf, the following parameters were undertaken in the zebrafish larvae: Mortality, DA neuron development, locomotor activity, antioxidant enzymes’ activities, oxidative stress and genes involved in the dopamine pathway.
Acknowledgments
This image is the copyrighted work of the attributed author or publisher, and
ZFIN has permission only to display this image to its users.
Additional permissions should be obtained from the applicable author or publisher of the image.
Full text @ Biomed. Pharmacother.