
- Title
-
Anatomy and development of the pectoral fin vascular network in the zebrafish
- Authors
- Paulissen, S., Castranova, D., Krispin, S., Burns, M.C., Menéndez, J., Torres-Vázquez, J., Weinstein, B.M.
- Source
- Full text @ Development
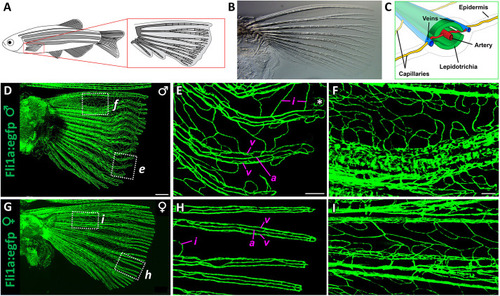
Vascular anatomy of the adult zebrafish pectoral fin. (A) Drawing of an adult zebrafish with a magnified view of the pectoral fin and its lepidotrichia (fin-ray bones). (B) Transmitted light image of a dissected pectoral fin. (C) Schematic showing a cross-section of a zebrafish fin ray. (D-I) Tiled confocal images of pectoral fins dissected from adult male (D-F) or adult female (G-I) Tg(fli1a:egfp)y1 transgenic zebrafish. E and F show higher-magnification views of the boxed regions in D. H and I show higher-magnification views of the boxed regions in G. a, fin-ray artery; i, fin-ray interlinking vessels; v, paired fin-ray veins. The asterisk in E denotes an artifact of image stitching. Images shown are representative of data collected from three separate male and three separate female adult fins, with consistent observation of the overall patterning of major vessels. Scale bars: 500 μm (B,D,G); 150 µm (E,H); 100 µm (F,I). |
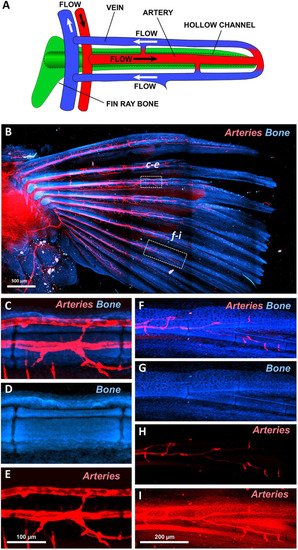
Fin ray-associated vasculature of the adult zebrafish pectoral fin. (A) Schematic illustrating circulatory flow through an individual adult zebrafish fin ray. Arteries are in red, veins in blue, and fin-ray bone in green. (B-I) Confocal images of an adult pectoral fin dissected from a Tg(kdrl:mcherry)y206 zebrafish, showing Tg(kdrl:mcherry)y20-positive arterial blood vessels (red) and autofluorescent bone (blue). (B) Low-magnification tiled confocal image of a dissected adult pectoral fin. (C-E) Higher-magnification confocal images of the boxed region (c-e) in B, showing Tg(kdrl:mcherry)y206-positive arteries (C,E) running through the center of autofluorescent bones (C,D) in the proximal region of a fin ray. (F-I) Higher-magnification confocal images of the boxed region (f-i) in B, showing weakly Tg(kdrl:mcherry)y206-positive arteries (F,H,I) running through the center of autofluorescent bones (F,G) in the distal region of a fin ray. I shows an ‘overexposed’ image of the fluorescence in H. Images shown are representative of three separate adult fins, with consistent observation of the overall patterning of major vessels. Scale bars: 500 μm (B); 100 µm (C-E); 200 µm (F-I). |
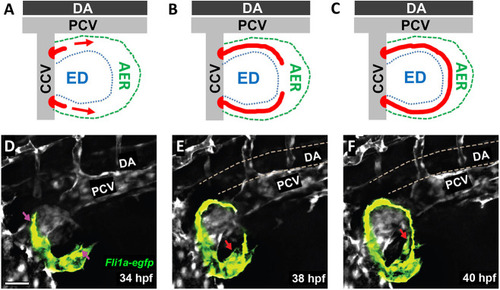
Formation of the primitive pectoral artery. (A-C) Schematics illustrating the stages of primitive pectoral artery formation, including initial dorsal and ventral sprouts from the CCV (A), elongation of these sprouts along the rim of the growing fin (B), and linkage of the two segments to form a complete primitive pectoral artery vascular arc (C). DA, dorsal aorta; ED, endoskeletal disk; PCV, posterior cardinal vein. (D-F) Still images taken from a time-lapse confocal time series of primitive pectoral artery formation in a Tg(fli1a:egfp)y1 transgenic zebrafish at 34 hpf (D), 38 hpf (E) and 40 hpf (F). Pink arrows indicate the emerging sprouts migrating into the pectoral fin, and red arrows indicate the emerging ventral arterial sprout. See Movie 2 for the complete time-lapse series. Images shown are representative of data collected from 12 separate embryos. Scale bar: 40 μm (D-F). |
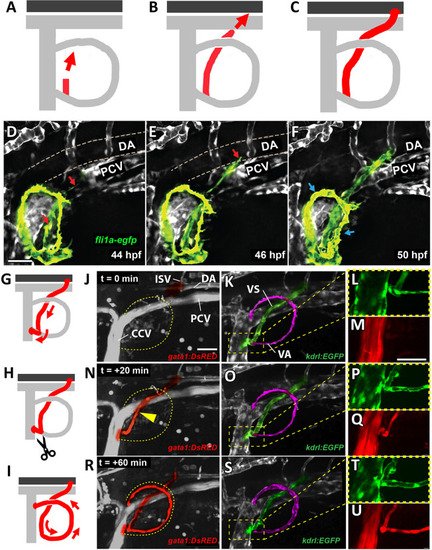
Perfusion of the primitive pectoral artery. (A-C) Schematics illustrating stages in the formation of a connecting link between the primitive pectoral artery and the dorsal aorta, including formation of a new sprout from the base of the primitive pectoral artery where it connects ventrally to the CCV (A), medial and dorsal-caudal elongation of the new vessel segment (B), and linkage to the dorsal aorta at or near the base of the second ISV (C). (D-F) Confocal still images from a time-lapse series showing formation of a connecting link between the primitive pectoral artery and the dorsal aorta in a Tg(fli1a:egfp)y1 transgenic zebrafish at 44 hpf (D), 46 hpf (E) and 50 hpf (F). Red arrows indicate the migratory direction of the arterial sprout, and blue arrows indicate perfusion of the primary arc. See Movie 2 for the complete time-lapse series. (G-I) Schematics illustrating initial shunting of flow from the dorsal aorta through the base of the pectoral fin directly to the CCV (G), followed by disconnection of this shunt (H) and re-routing of flow through the primitive pectoral artery primary arc (I). (J-U) Confocal images from a time-lapse series of the pectoral fin and adjacent structures in a 2-day-old Tg(gata1:dsred)sd2Tg, Tg(kdrl:egfp)s843 double-transgenic zebrafish, showing Tg(gata1:dsred)sd2Tg-positive blood cells (J,M,N,Q,R,U) and Tg(kdrl:egfp)s843-positive blood vessels (K,L,O,P,S,T). L, P and T show higher-magnification images of the boxed areas in K, O and S, respectively; likewise, M, Q and U are higher-magnification images of the corresponding areas in J, N and R, respectively. (J-M) t=0 min. The vascular link to the dorsal aorta has assembled (highlighted green in K) but has not yet lumenized, and no blood flow is present. (N-Q) t=+20 min. The connection to the dorsal aorta (highlighted green in O) has been completed and blood is now flowing through this connecting vessel (highlighted red in N and Q), but the blood is being shunted directly to the CCV without perfusing the primitive pectoral artery arc (highlighted magenta in K,O,S). (R-U) t=+60 min. The shunt to the CCV has disconnected and all blood flow has been rerouted into the primitive pectoral artery arc (highlighted red in R and U). Blood is only emptying into the CCV through the dorsal connection. See Movie 4 for the complete time-lapse series. See Movies 5 and 6 for higher-magnification images and 3D reconstructions of the ventral junction to the CCV and its shunting and then disconnection. Images shown are representative of data collected from 11 separate embryos. Yellow arrowhead in N indicates red blood cells flowing through the arterial sprout, and dashed yellow line encircles primary arc in J,N,R. DA, dorsal aorta; PCV, posterior cardinal vein; VA, ventral arm of the primary arc; VS, ventral arterial sprout. Scale bars: 30 μm (D-F); 40 μm (J-U). |
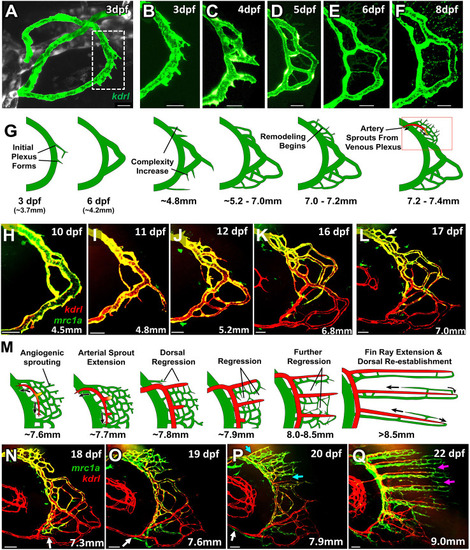
Formation of the distal fin-ray vasculature. (A) Confocal image of the pectoral fin vessels (green) of a 3 dpf Tg(kdrl:egfp)s843 transgenic zebrafish (other surrounding vessels in gray). Dashed box indicates the approximate area imaged in B-F. (B-F) Confocal image time series of the pectoral fin distal vascular plexus of the same Tg(kdrl:egfp)s843 transgenic zebrafish as in A, imaged at 3 (B), 4 (C), 5 (D), 6 (E) and 8 (F) dpf. (G) Schematic illustrating the series of events occurring in the distal fin from ∼3 dpf to 18 dpf (up to ∼7.4 mm), encompassing the stages shown in A-L. (H-L) Confocal image time series of the pectoral fin distal vascular plexus of the same Tg(kdrl:mcherry)y206, Tg(mrc1a:egfp)y251 double-transgenic larva imaged at 10 (H), 11 (I), 12 (J), 16 (K) and 17 (L) dpf (4.5, 4.8, 5.2, 6.8 and 7.0 mm in length, respectively). See Movie 9 for 3D reconstructions of the image in L. (M) Schematic illustrating the series of events occurring in the distal fin from ∼18 dpf to 22 dpf (7.3 to 9.0 mm), encompassing the stages shown in N-Q. (N-Q) Confocal image time series of the pectoral fin distal vascular plexus of the same Tg(kdrl:mcherry)y206, Tg(mrc1a:egfp)y251 double-transgenic larva imaged at 18 (N), 19 (O), 20 (P) and 22 (Q) dpf (7.3, 7.6, 7.9 and 9.0 mm in length, respectively). See Movie 10 for 3D reconstructions of the images in N-Q. White arrows denote the ventral extent of the Tg(mrc1a:egfp)y251 blood vessel; cyan arrows denote rarified areas of the distal plexus; magenta arrows denote the new venous sprouts that will form the dorsal fin-ray vein. A ‘time series’ of the images in H-Q is shown in Movie 11. Images shown are representative of data collected from 12 separate larvae. Scale bars: 50 μm. |
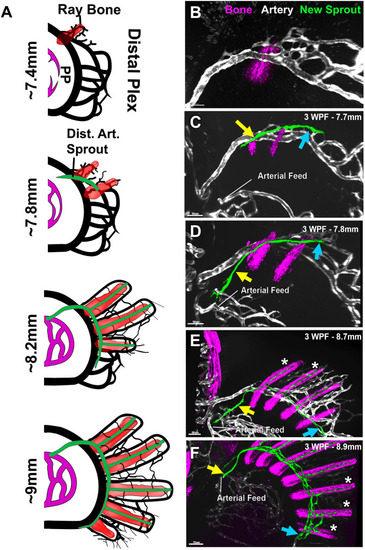
The formation of the distal fin-ray arterial network begins as a sprout from the distal venous plexus. (A) Schematic of the relationship between the developing fin-ray bones (red) and developing fin-ray arterial network (green) that emerges from the pectoral fin distal vascular plexus (black) in ∼7.4-9.0 mm fish. (B-F) Confocal images of the pectoral fin distal vascular plexuses of separate 3-week-old Tg(Ola.Sp7:mCherryEco.NfsB)pd46, Tg(kdrl:egfp)s843 double-transgenic zebrafish of different sizes, with Tg(Ola.Sp7:mCherryEco.NfsB)pd46-positive condensing bone in magenta and Tg(kdrl:egfp)s843-positive vessels in gray, except for the emerging fin-ray arterial network which is false-colored in green. Larvae shown are 7.4 mm, (B), 7.7 mm (C), 7.8 mm (D), 8.7 mm (E) and 8.9 mm (F) in length. Yellow and blue arrows indicate the proximal/dorsal and distal/ventral ends, respectively, of the developing fin-ray arterial vascular network. White asterisks indicate developing fin-ray arteries. Images shown are representative of data collected from six separate larvae. Dist. Art., distal arterial sprout; Distal Plex, distal plexus; PP, proximal plexus; WPF, weeks post-fertilization. Scale bars: 50 μm (B-E); 70 μm (F). |
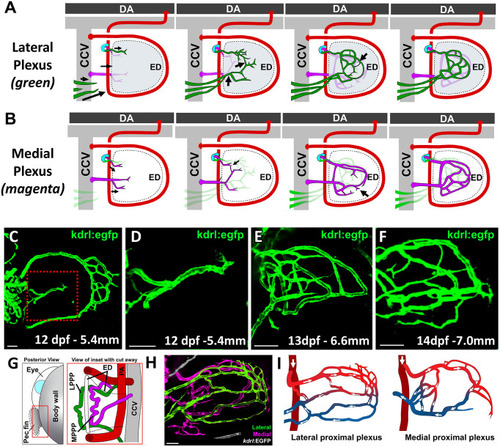
Formation of the proximal vascular plexus. (A,B) Schematics illustrating the growth and development of the lateral (A; in green) and medial (B; in magenta) proximal plexuses in association with the pectoral fin endoskeletal disk, occurring approximately between 6 mm and 8 mm larval length. (C-F) Confocal images of the pectoral fin vasculature of three separate Tg(kdrl:egfp)s843 larvae at 12 dpf (C,D), 13 dpf, (E) and 14 dpf (F). The red box in C indicates the approximate location of the higher-magnification images in D-F, which show the proximal plexus in progressively older animals. (G) Schematic illustrating the positioning of the lateral and medial pectoral proximal plexuses, (LPPP and MPPP, respectively) on either side of the endoskeletal disk within the larval pectoral fin. (H) Confocal image of an 18 dpf Tg(kdrl:egfp)s843 fish with the medial and lateral proximal plexuses false-colored in magenta and green, respectively. Note the vessels in the lateral plexus that disappear rostrally from the image. See Movie 13 for D image reconstructions of the same confocal stack shown in H. (I) Schematics illustrating the morphology and circulatory flow patterns of the lateral (left) and medial (right) proximal vascular plexuses shown in the confocal image in H. Red and blue labeling facilitates visualization of vessels supplying or draining the plexuses. Images shown are representative of data collected from ten separate larvae. DA, dorsal aorta; ED, endoskeletal disk; PA, pectoral artery; Pec fin, pectoral fin. Scale bars: 50 μm. |
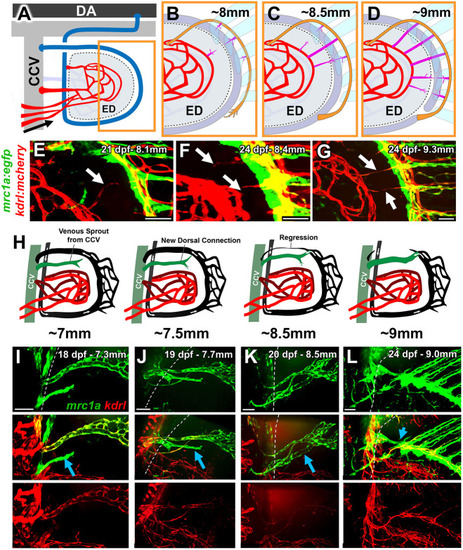
Late-stage remodeling leading to the formation of the interplexus bridges and regression of the dorsal arm of the primary arc. (A-D) Schematics illustrating the formation of links between proximal and distal vascular plexuses. DA, dorsal aorta; ED, endoskeletal disk. (A) Simplified overview diagram of the pectoral fin vasculature at ∼3.5 weeks, showing the proximal plexus (red) and arterial feed for the distal fin-ray vascular network (orange). Orange box in A shows the approximate magnified area depicted in B-D. (B-D) Stages in the formation of inter-plexus links. (E-G) Confocal images of the inter-plexus region of the pectoral fin of three separate 3.5-week-old Tg(kdrl:mcherry)y206, Tg(mrc1a:egfp)y251 double-transgenic zebrafish, showing the formation of arterial [Tg(kdrl:mcherry)y206 positive, Tg(mrc1a:egfp)y251 negative] links (white arrows) between the medial proximal plexus (left) and the arterial fin-ray vascular plexus (right). (H) Schematics of the replacement of the dorsal arm of the primary arc. (I-L) Confocal images of the dorsal arm of the pectoral fin primary arc showing the early Tg(mrc1a:egfp)y251-positive, Tg(kdrl:mcherry)y206-negative sprout (I), the elongation of the sprout toward the distal plexus (J), two lumenized connections leading to the CCV (K), and the regression of the original dorsal arm of the primary arc, leaving only the new, deeper connection (L). Cyan arrows emphasize the new venous sprout in each panel. Dashed lines indicate the common cardinal vein. Images shown in E-G and I-L are representative of data collected from 12 separate larvae. Scale bars: 50 μm. |
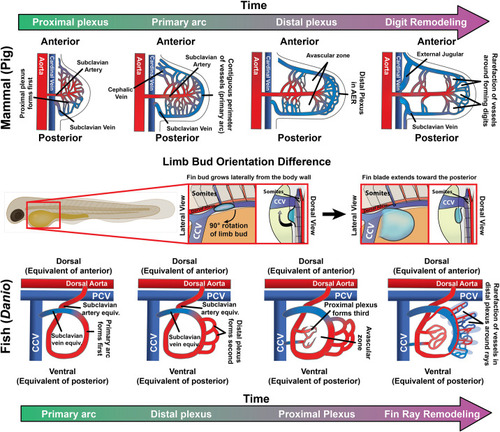
Schematic of pectoral fin vascular development. Schematics comparing broad stages of forelimb vasculature development in zebrafish and mammals. (A) In mammalian forelimbs, vascular development begins with initial growth of a limb bud-associated capillary plexus and formation of a single predominant arterial feed, the subclavian artery, followed by assembly of a complete circumferential vessel draining to the subclavian vein (and eventually into the cardinal vein). This primitive network expands as the limb grows out, elaborating mid-limb and distal (AER-associated) vascular plexuses separated by an avascular zone. Finally, the distal-most portion of the limb vasculature remodels around the forming digits. (B) In comparison to mammals, the fish limb bud is rotated 90° so that the anterior portion of the fin bud is pointed dorsally instead (the z-axis, from a lateral view of the embryo as in B). A, anterior; P, posterior. (C) In the zebrafish pectoral fin, a circumferential vessel forms first, drawing arterial blood from the dorsal aorta as in mammals but draining into the CCV rather than the (posterior) cardinal vein as in mammals. This circumferential vessel (the primary arc) is analogous to the subclavian artery and vein of mammals. Next, a distal AER-associated plexus forms followed closely by formation of a proximal plexus, leaving a mid-limb avascular zone as in mammals. Lastly, the distal plexus remodels to generate the fin-ray vasculature. PCV, posterior cardinal vein. |