
- Title
-
Microcrater-Arrayed Chemiluminescence Cell Chip to Boost Anti-Cancer Drug Administration in Zebrafish Tumor Xenograft Model
- Authors
- Kuo, C.T., Lai, Y.S., Lu, S.R., Lee, H., Chang, H.H.
- Source
- Full text @ Biology (Basel)
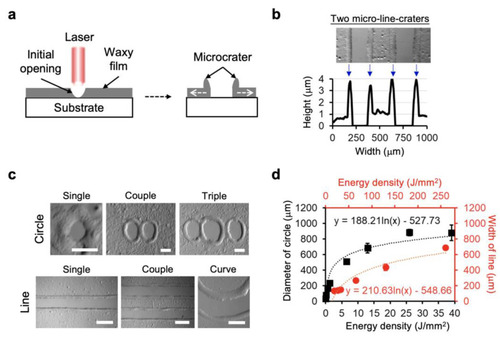
Laser direct writing on waxy films coated on glass slide substrates: (a) Illustration showing the waxy microcrater patterns carried by laser direct writing. (b) Surface profile of the two typical micro-line craters by laser writing on the waxy film-coated substrate. (c) Representative micrographs showing the capability of fabricating both circle and line patterns on the substrate by laser writing. Scale bars are 50 µm in top panel and 200 µm in bottom panel. (d) Relationship between the fabricated size of circle (black color) or line (red color) pattern and the energy density applied by the CO2 laser. Data represent the mean ± SD, n = 3 for circle pattern and n = 4 for line pattern. |
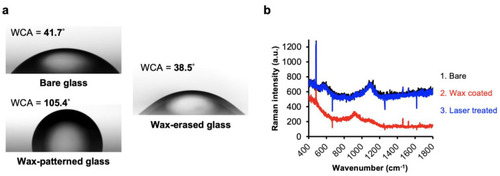
Complete removal of the patterned wax films by laser direct writing: (a) Comparison of water contact angle (WCA) measured from bare glass, wax-patterned glass, and wax-erased glass by CO2 laser. (b) Raman spectra of the glass slide substrate during the three different treatments, including bare substrate (black), wax coating (red), and laser writing (blue). |

High-throughput drug screening by the microcrater-arrayed (µCA) chips: (a) Experimental procedure of the drug screening. (b) Demonstration for the high-throughput drug screening on SK-N-DZ cells by the µCA chip. Live cells were evaluated based on the detection of chemiluminescence. Cyp: cyclophosphamide; Cis: cisplatin; Dox: doxorubicin; Onc: oncovin; Eto: etoposide. Scale bar is 170 µm, and the insert bar is 50 µm. Data represent the mean ± SD, n = 3 independent experiments. |
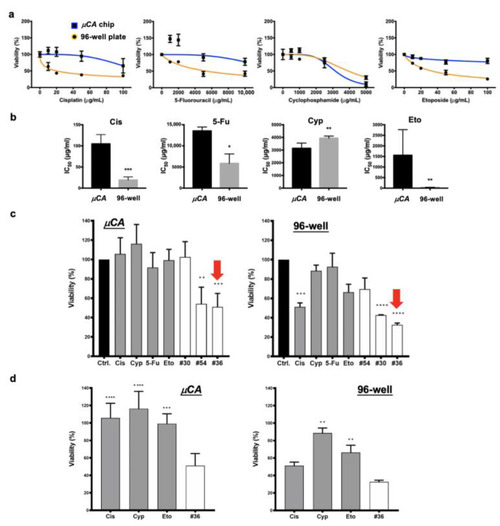
Comparisons of drug testing derived from the µCA chip and the conventional 96-well plate: (a) Drug profiles of 24 h cisplatin (Cis), 5-fluorouracil (5-Fu), cyclophosphamide (Cyp), and etoposide (Eto) acting on MCF-7 cells, which are derived from µCA chips and 96-well plates, respectively. The lowest drug concentration used for each screening was 0 µg/mL. (b) Comparison of the drug IC50 values derived from µCA chip and 96-well plate results (Figure 4a). (c) Comparison of cell viabilities obtained from the optimal drug combinations and the corresponding single-drug treatments. The single-drug concentrations were 15 µg/mL (49.8 μM), 400 µg/mL (1532 μM), 3000 µg/mL (23,280 μM), and 10 µg/mL (17 μM) for Cis, Cyp, 5-Fu, and Eto, respectively. All data were compared to the control. The optima were selected from #30, #36, and #54 groups; please refer Supplementary Figures S2 and S3 for more detail. The red arrows represent the optimized drug combinations. (d) Comparisons of cell viabilities obtained from the optimized #36 combination and the corresponding single-drug treatments. Data represent the mean ±SD, n = 3 independent experiments. * p < 0.05, ** p < 0.01, *** p < 0.001, and **** p < 0.0001. |

Verification of the drug combination efficacy via the in vivo zebrafish tumor xenograft models: (a) Procedure of the zebrafish xenograft assay; MCF-7 cells were used for this model. (b) In vivo tumor inhibiting rates of the evaluated drug combinations from the µCA chip and the corresponding single drugs used. The concentrations of cisplatin (Cis), 5-fluorouracil (5Fu), cyclophosphamide (Cyp), and etoposide (Eto) were 15 µg/mL (49.8 μM), 3000 µg/mL (23,280 μM), 400 (1532 μM) µg/mL, and 10 µg/mL (17 μM), respectively. Groups #30, #36 and #54 are given in Figures S2 and S3. “n” indicates the total number of zebrafishes used for each assay. Each datum was normalized by the average fluorescence density (intensity/pixel2) of control group (Con). *** p < 0.001 and **** p < 0.0001. |

Efficacy of the optimal drug combinations inhibiting MCF-7 cells and tumors cultured in different models: (a) The zebrafish tumor xenograft model. (b) The µCA chip model. (c) The 96-well plate model. (d) Comparison of the absolute error rates derived from the µCA chip and the 96-well plate. The values are defined as the different rates of cell viability compared to those derived from xenografts. (e) Comparison of the tumor-inhibiting yield derived from xenograft, µCA chip, and 96-well plate. Drug combinations (#30, #36, and #54) and the corresponding single drugs used can be seen in Figure 5b. Results show that the in vitro drug efficacy (17.9% error rate and 57.1% prediction rate) derived from the µCA chip partially simulates the in vivo zebrafish results, compared to 96-well plate model (37.5% error rate and 28.6% prediction rate). Control groups are denoted as Ctrl. Numbers of zebrafish used for each test can be seen in Figure 5b. * p < 0.05, ** p < 0.01, *** p < 0.001, and **** p < 0.0001. |