
|
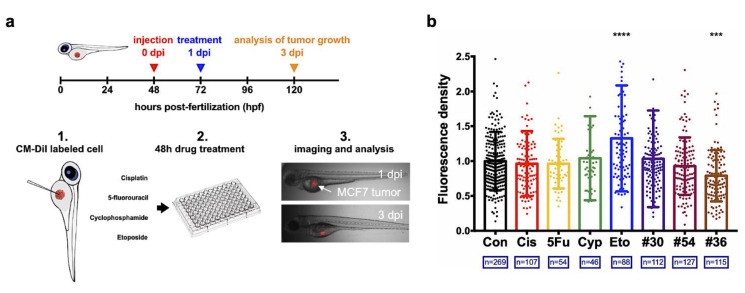
Figure 5 Verification of the drug combination efficacy via the in vivo zebrafish tumor xenograft models: (a) Procedure of the zebrafish xenograft assay; MCF-7 cells were used for this model. (b) In vivo tumor inhibiting rates of the evaluated drug combinations from the µCA chip and the corresponding single drugs used. The concentrations of cisplatin (Cis), 5-fluorouracil (5Fu), cyclophosphamide (Cyp), and etoposide (Eto) were 15 µg/mL (49.8 μM), 3000 µg/mL (23,280 μM), 400 (1532 μM) µg/mL, and 10 µg/mL (17 μM), respectively. Groups #30, #36 and #54 are given in Figures S2 and S3. “n” indicates the total number of zebrafishes used for each assay. Each datum was normalized by the average fluorescence density (intensity/pixel2) of control group (Con). *** p < 0.001 and **** p < 0.0001.