
Figure 4
- ID
- ZDB-FIG-220131-558
- Publication
- Kuo et al., 2021 - Microcrater-Arrayed Chemiluminescence Cell Chip to Boost Anti-Cancer Drug Administration in Zebrafish Tumor Xenograft Model
- Other Figures
- All Figure Page
- Back to All Figure Page
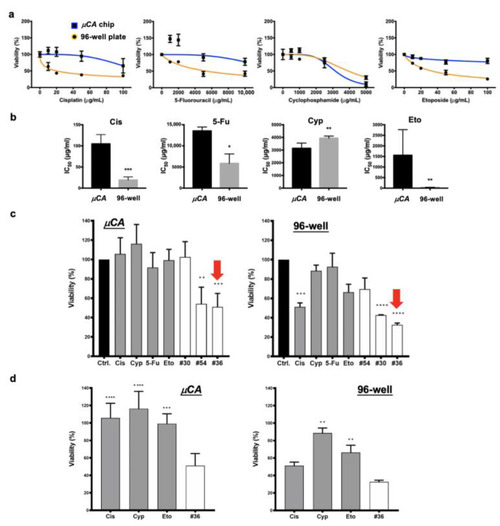
Comparisons of drug testing derived from the µCA chip and the conventional 96-well plate: (a) Drug profiles of 24 h cisplatin (Cis), 5-fluorouracil (5-Fu), cyclophosphamide (Cyp), and etoposide (Eto) acting on MCF-7 cells, which are derived from µCA chips and 96-well plates, respectively. The lowest drug concentration used for each screening was 0 µg/mL. (b) Comparison of the drug IC50 values derived from µCA chip and 96-well plate results (Figure 4a). (c) Comparison of cell viabilities obtained from the optimal drug combinations and the corresponding single-drug treatments. The single-drug concentrations were 15 µg/mL (49.8 μM), 400 µg/mL (1532 μM), 3000 µg/mL (23,280 μM), and 10 µg/mL (17 μM) for Cis, Cyp, 5-Fu, and Eto, respectively. All data were compared to the control. The optima were selected from #30, #36, and #54 groups; please refer Supplementary Figures S2 and S3 for more detail. The red arrows represent the optimized drug combinations. (d) Comparisons of cell viabilities obtained from the optimized #36 combination and the corresponding single-drug treatments. Data represent the mean ±SD, n = 3 independent experiments. * p < 0.05, ** p < 0.01, *** p < 0.001, and **** p < 0.0001. |