
|
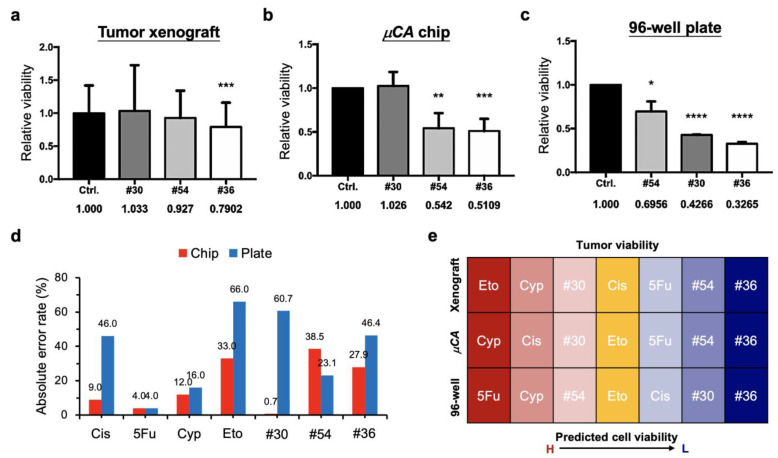
Figure 6 Efficacy of the optimal drug combinations inhibiting MCF-7 cells and tumors cultured in different models: (a) The zebrafish tumor xenograft model. (b) The µCA chip model. (c) The 96-well plate model. (d) Comparison of the absolute error rates derived from the µCA chip and the 96-well plate. The values are defined as the different rates of cell viability compared to those derived from xenografts. (e) Comparison of the tumor-inhibiting yield derived from xenograft, µCA chip, and 96-well plate. Drug combinations (#30, #36, and #54) and the corresponding single drugs used can be seen in Figure 5b. Results show that the in vitro drug efficacy (17.9% error rate and 57.1% prediction rate) derived from the µCA chip partially simulates the in vivo zebrafish results, compared to 96-well plate model (37.5% error rate and 28.6% prediction rate). Control groups are denoted as Ctrl. Numbers of zebrafish used for each test can be seen in Figure 5b. * p < 0.05, ** p < 0.01, *** p < 0.001, and **** p < 0.0001.