
- Title
-
Carbonic anhydrase inhibitor induces otic hair cell apoptosis via an intrinsic pathway and ER stress in zebrafish larvae
- Authors
- Matsumoto, H., Miyagi, H., Nakamura, N., Shiga, Y., Ohta, T., Fujiwara, S., Tsuzuki, M.
- Source
- Full text @ Toxicol Rep
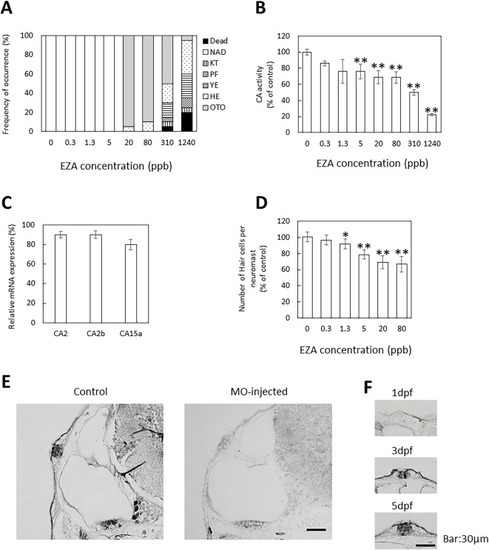
Effects of EZA exposure on CA activity and otic neuromast development and location of CA in otic neuromasts. (A) Effects of EZA during zebrafish development. Analysis was performed at 3 dpf; 20 embryos were observed for each dose. The values are percentage of abnormal embryos. NAD, no abnormality detected; KT, kinked tail; PF, irregular pectoral fin; YE, Yolk edema; HE, Heart edema; OTO, small otolith. (B) Effects of EZA on CA activity. CA activity in the cytosol fraction of larvae treated with various concentrations of EZA for 3 days was measured at 3 dpf. (C) Effects of EZA on CA mRNA levels. mRNA levels of CA2, 2b and 15a in larvae treated with 80 ppb EZA for 3 days was determined at 3 dpf. The mRNA levels were measured by quantitative real-time PCR using the comparative Ct method. β-Actin was used as an internal control for normalization. (D) Effects of EZA on otic neuromast. Hair cells of otic neuromasts labeled with YO-PRO-1 after exposure to various concentrations of EZA for 3 days were counted. (E, F) Location of CA in otic neuromast. Localization of CA2 in otic neuromasts of normal zebrafish at 5 dpf (E) and 1–5 dpf (F) visualized by immunohistochemical staining. Transverse sections of otocysts in non-treated (E, F) and MO-injected (E) larvae were stained with rabbit anti-CA antiserum. The values are expressed as arbitrary units and as percentages of the control. The data are means ± SD (n = 3). Asterisks indicate significant differences from the control (ANOVA followed by Dunnet’s test: *p < 0.05, **p < 0.01). |
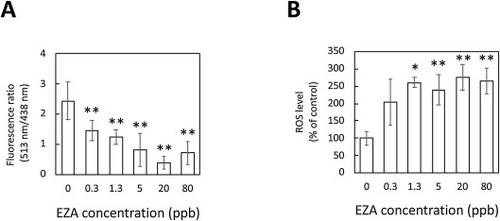
pH decrease and ROS generation in larvae induced by EZA. (A) pH decrease in larvae on EZA treatment. pH changes in 3-dpf larvae treated with 0–80 ppb EZA for 3 days. (B) The ROS levels in 3-dpf larvae treated with EZA. The levels are expressed as percentages of the control. The data are means ± SD (n = 3). Asterisks indicate significant differences from the control (ANOVA followed by Dunnet’s test: *p < 0.05, **p < 0.01). |
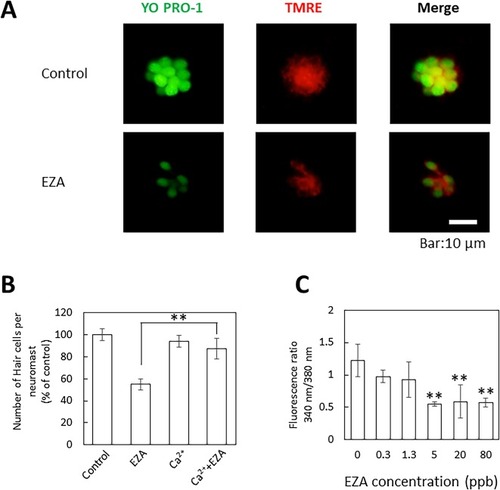
Effects of EZA on mitochondrial transmembrane potential in otic neuromasts (A) and Ca2+ concentration in larvae (C), and relief of EZA toxicity by Ca2+ (B). (A) The mitochondrial transmembrane potential of otic neuromast cells in larvae (3 dpf) treated with 80 ppb EZA for 3 days was assessed by tetramethylrhodamine ethyl ester (TMRE) staining assay. (B) Zebrafish larvae (3 dpf) were treated with 80 ppb EZA in high calcium medium, and the number of hair cells in otic neuromasts was compared to that in the control and with EZA only. The levels are expressed as percentages of the control. The data are means ± SD (n = 3). Asterisks indicate significant differences from EZA (ANOVA followed by Dunnet’s test: **p < 0.01). (C) The calcium levels in 3-dpf larvae treated with EZA. The data are means ± SD (n = 3). Asterisks indicate significant differences from the control (ANOVA followed by Dunnet’s test: **p < 0.01). |
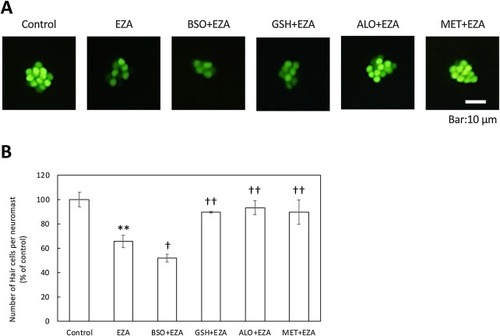
Relief of EZA toxicity toward otic hair cells by anti-oxidants. Zebrafish larvae (3 dpf) were co-treated with 80 ppb EZA and glutathione (GSH), allopurinol (ALO), or D-methionine (MET) as anti-oxidants, or buthionine sulfoximine (BSO), an inhibitor of GSH synthesis, as a pro-oxidant, and then hair cells in otic neuromasts were visualized with YO-PRO-1 (A) and counted (B). The bars represent means ± SD (n = 3). Asterisks or daggers indicate significant differences from the control or EZA (Student’s t-test, *p < 0.05 vs control, †p < 0.05 vs EZA, ††p < 0.01 vs EZA). |
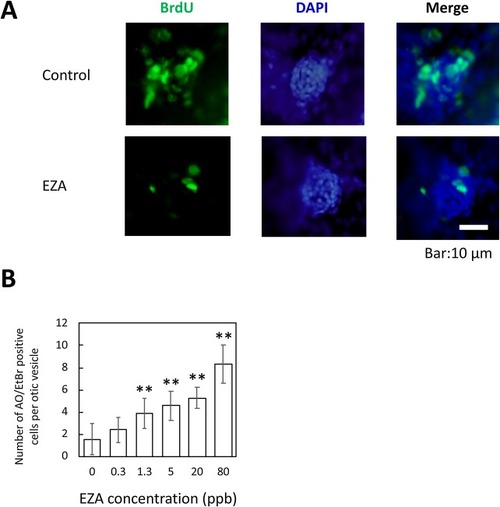
Effect of EZA on otic neuromast cell proliferation and apoptotic cells in otic vesicle. (A) Repression of progression to the S-phase of the cell cycle by EZA. DNA-replicating cells were labeled with BrdU. (B) Apoptosis of cells in the otic vesicle. Apoptotic cells were detected by Acridine orange/Ethidium bromide, and were counted and plotted as mean ± SD (n = 3). Asterisks indicate significant differences from the control (ANOVA followed by Dunnet’s test: **p < 0.01). |
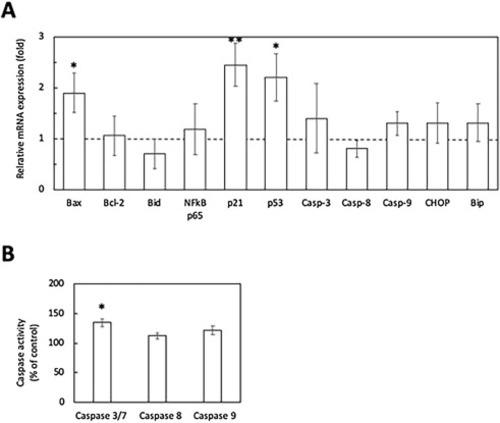
Effects of EZA treatment on expression of genes for the apoptotic pathway (A) and caspase activities (B). The otic mRNA expression levels of some markers for the apoptotic pathway (A) and caspase activities (B) in inner ears isolated from EZA-treated zebrafish larvae (3 dpf) were determined. The EZA treatment was performed at 80 ppb for 3 days. The mRNA levels were measured by quantitative real-time PCR using the comparative Ct method. β-Actin was used as an internal control for normalization. The bars represent means ± SD (n = 3) (Student’s t-test, *p < 0.05, **p < 0.01). |
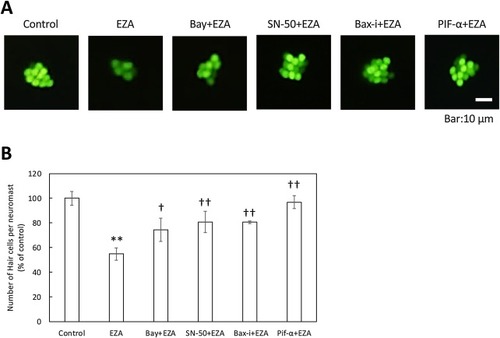
Relief of EZA toxicity toward otic hair cells by apoptotic inhibitors. Zebrafish larvae (3 dpf) were treated with Bay 11-7085 (Bay) or SN-50 as NF-κB inhibitors, or Bax inhibitor (Bax-i), or PIF-α as a p53 inhibitor, in the presence of EZA at 80 ppb for 3 days, and then hair cells in otic neuromasts were visualized with YO-PRO-1 (A) and counted (B). The bars represent means ± SD (n = 3). Asterisks or daggers indicate significant differences from the control or EZA (Student’s t-test, *p < 0.05 vs control, †p < 0.05 vs EZA, ††p < 0.01 vs EZA). |